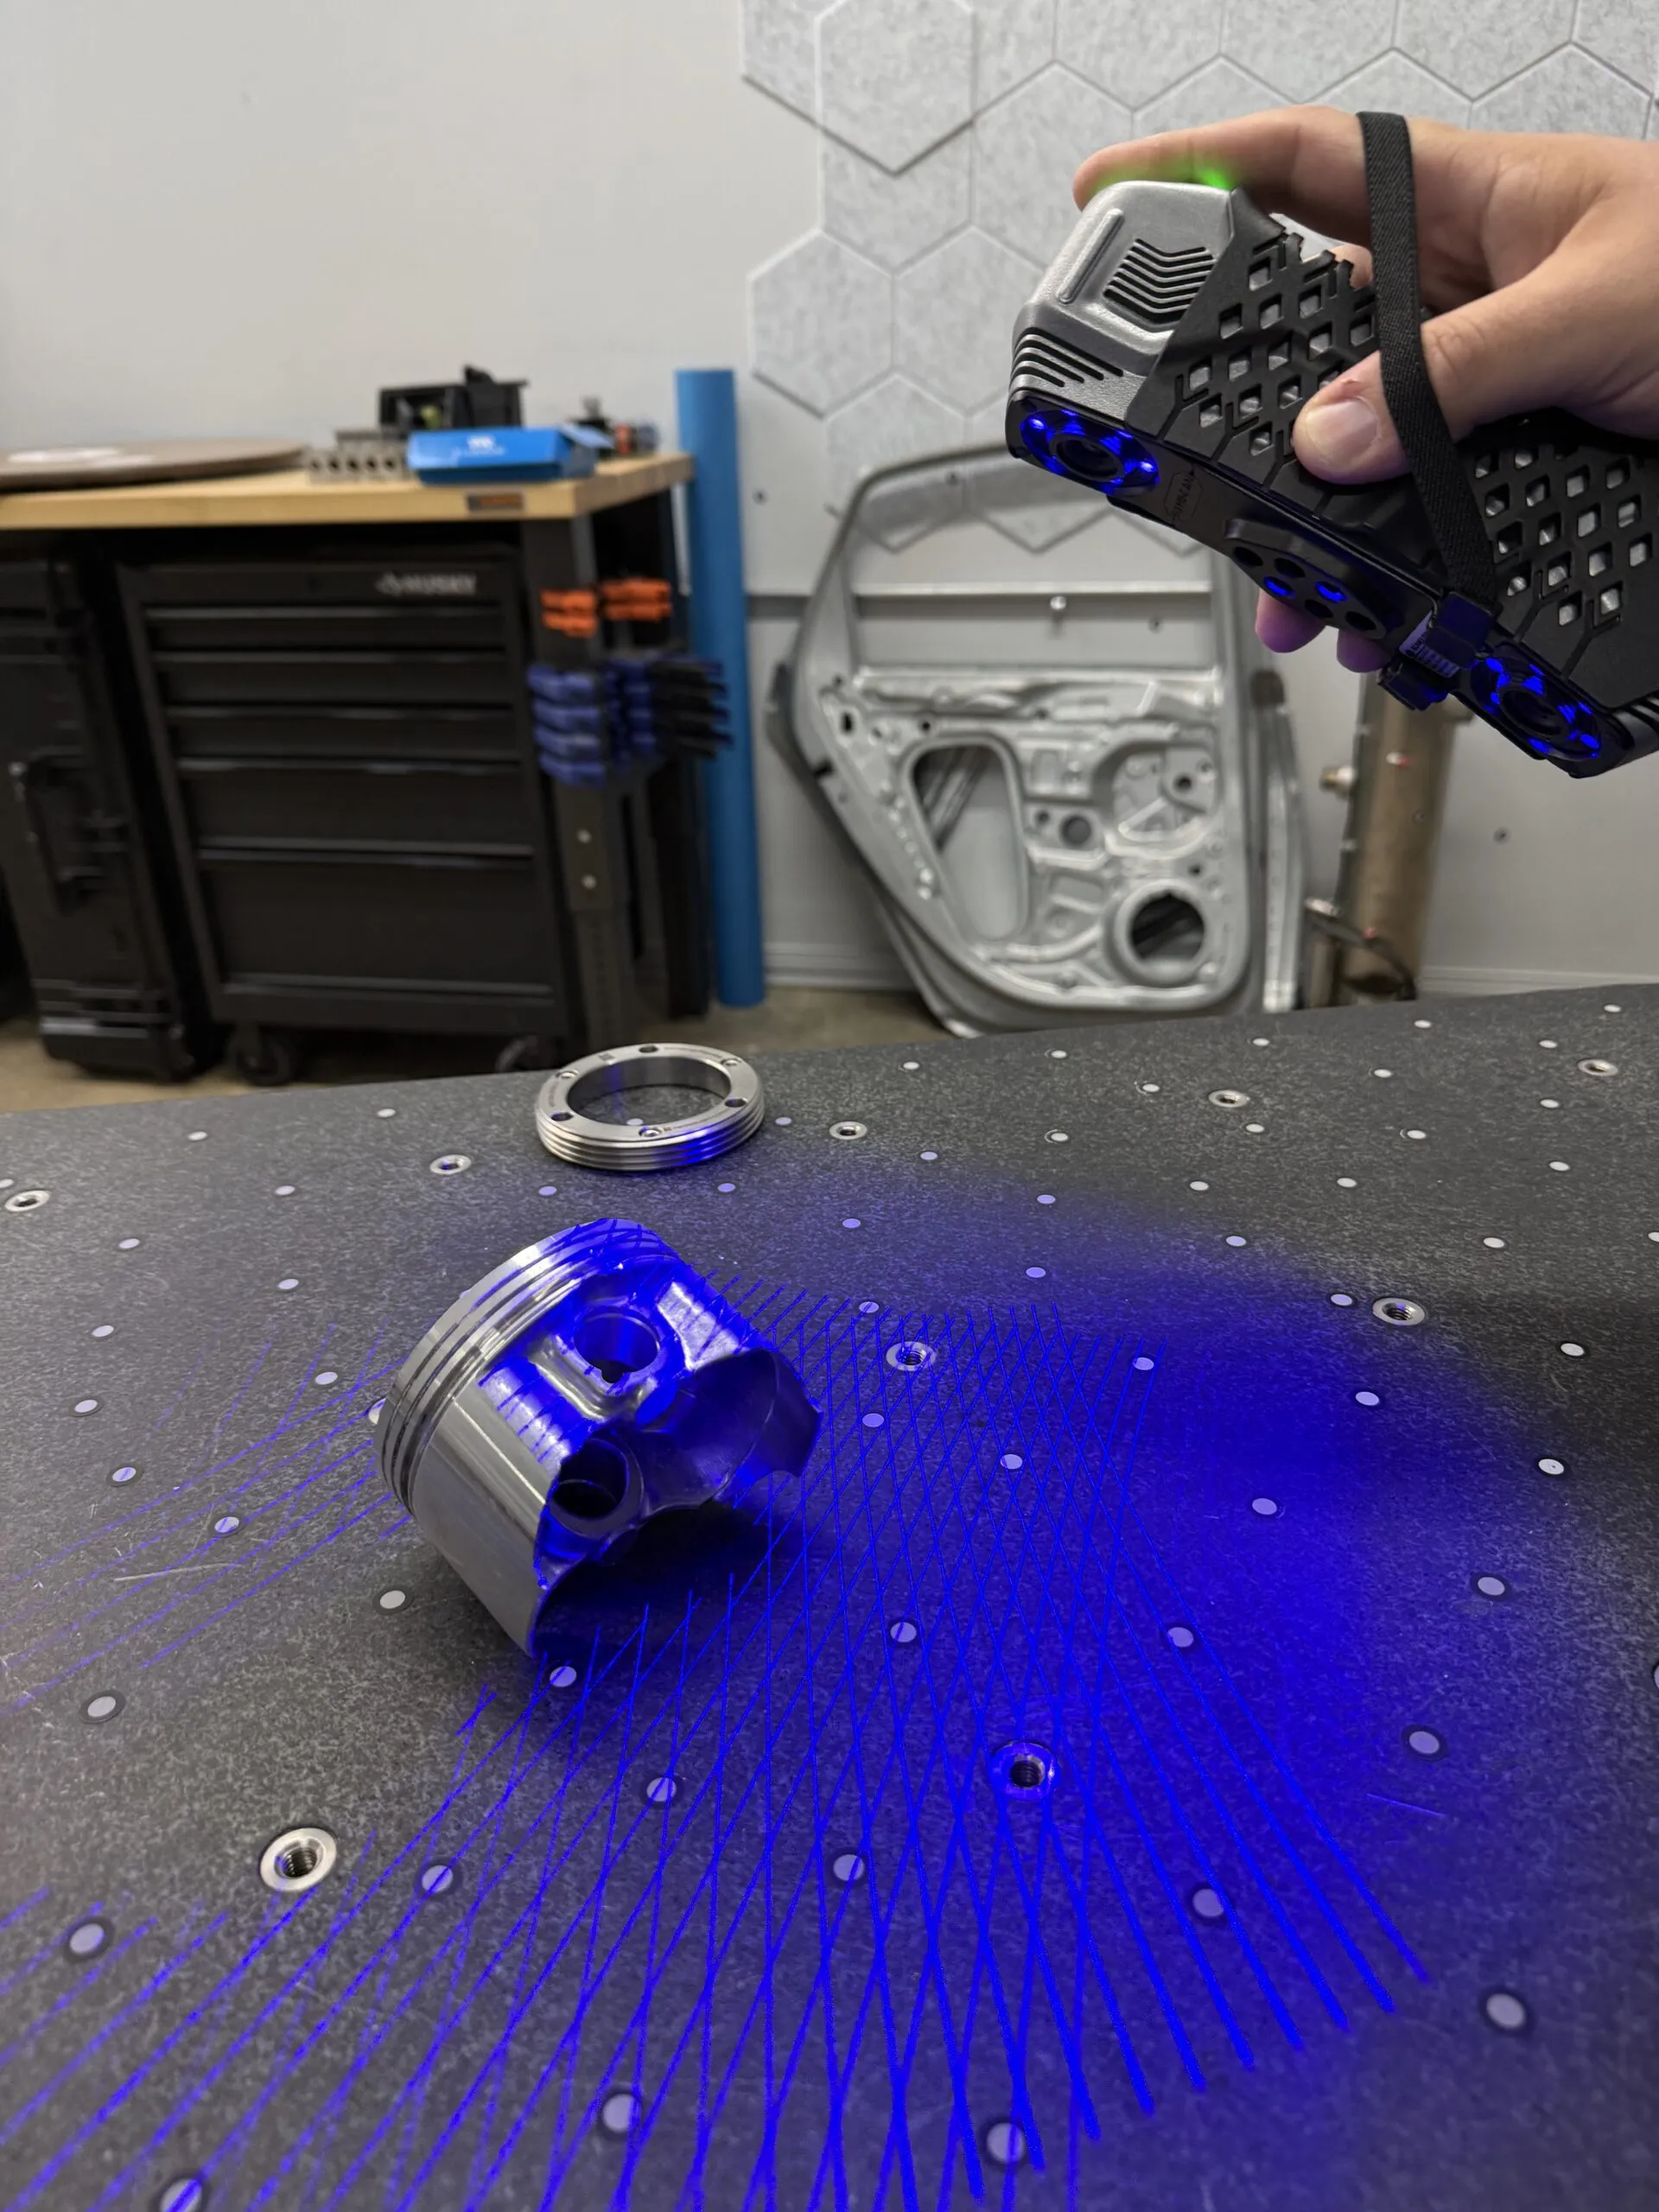
How Does 3D Scanning Work? A Beginner’s Guide to the Technology
You have a part on the bench and no drawing for it. Or you have the drawing, and now you

A capital request for a $20,000 to $80,000 3D scanner rarely fails on the technology. It fails because the engineer asking for it can’t answer the question a CFO actually cares about: what does this return, and when? This article gives manufacturing leaders a practical framework for calculating the ROI of a 3D scanner in a manufacturing environment, with a worked model you can adapt, a payback timeline you can defend, and the hidden costs that wreck naive projections.
We’ll break the return into five measurable components, walk through a step-by-step model with illustrative numbers, and show how to translate engineering benefits into the language of finance. The ranges here are typical and illustrative, not promises tied to any single customer. Plug in your own labor rates, scrap costs, and volumes, and the model becomes yours.
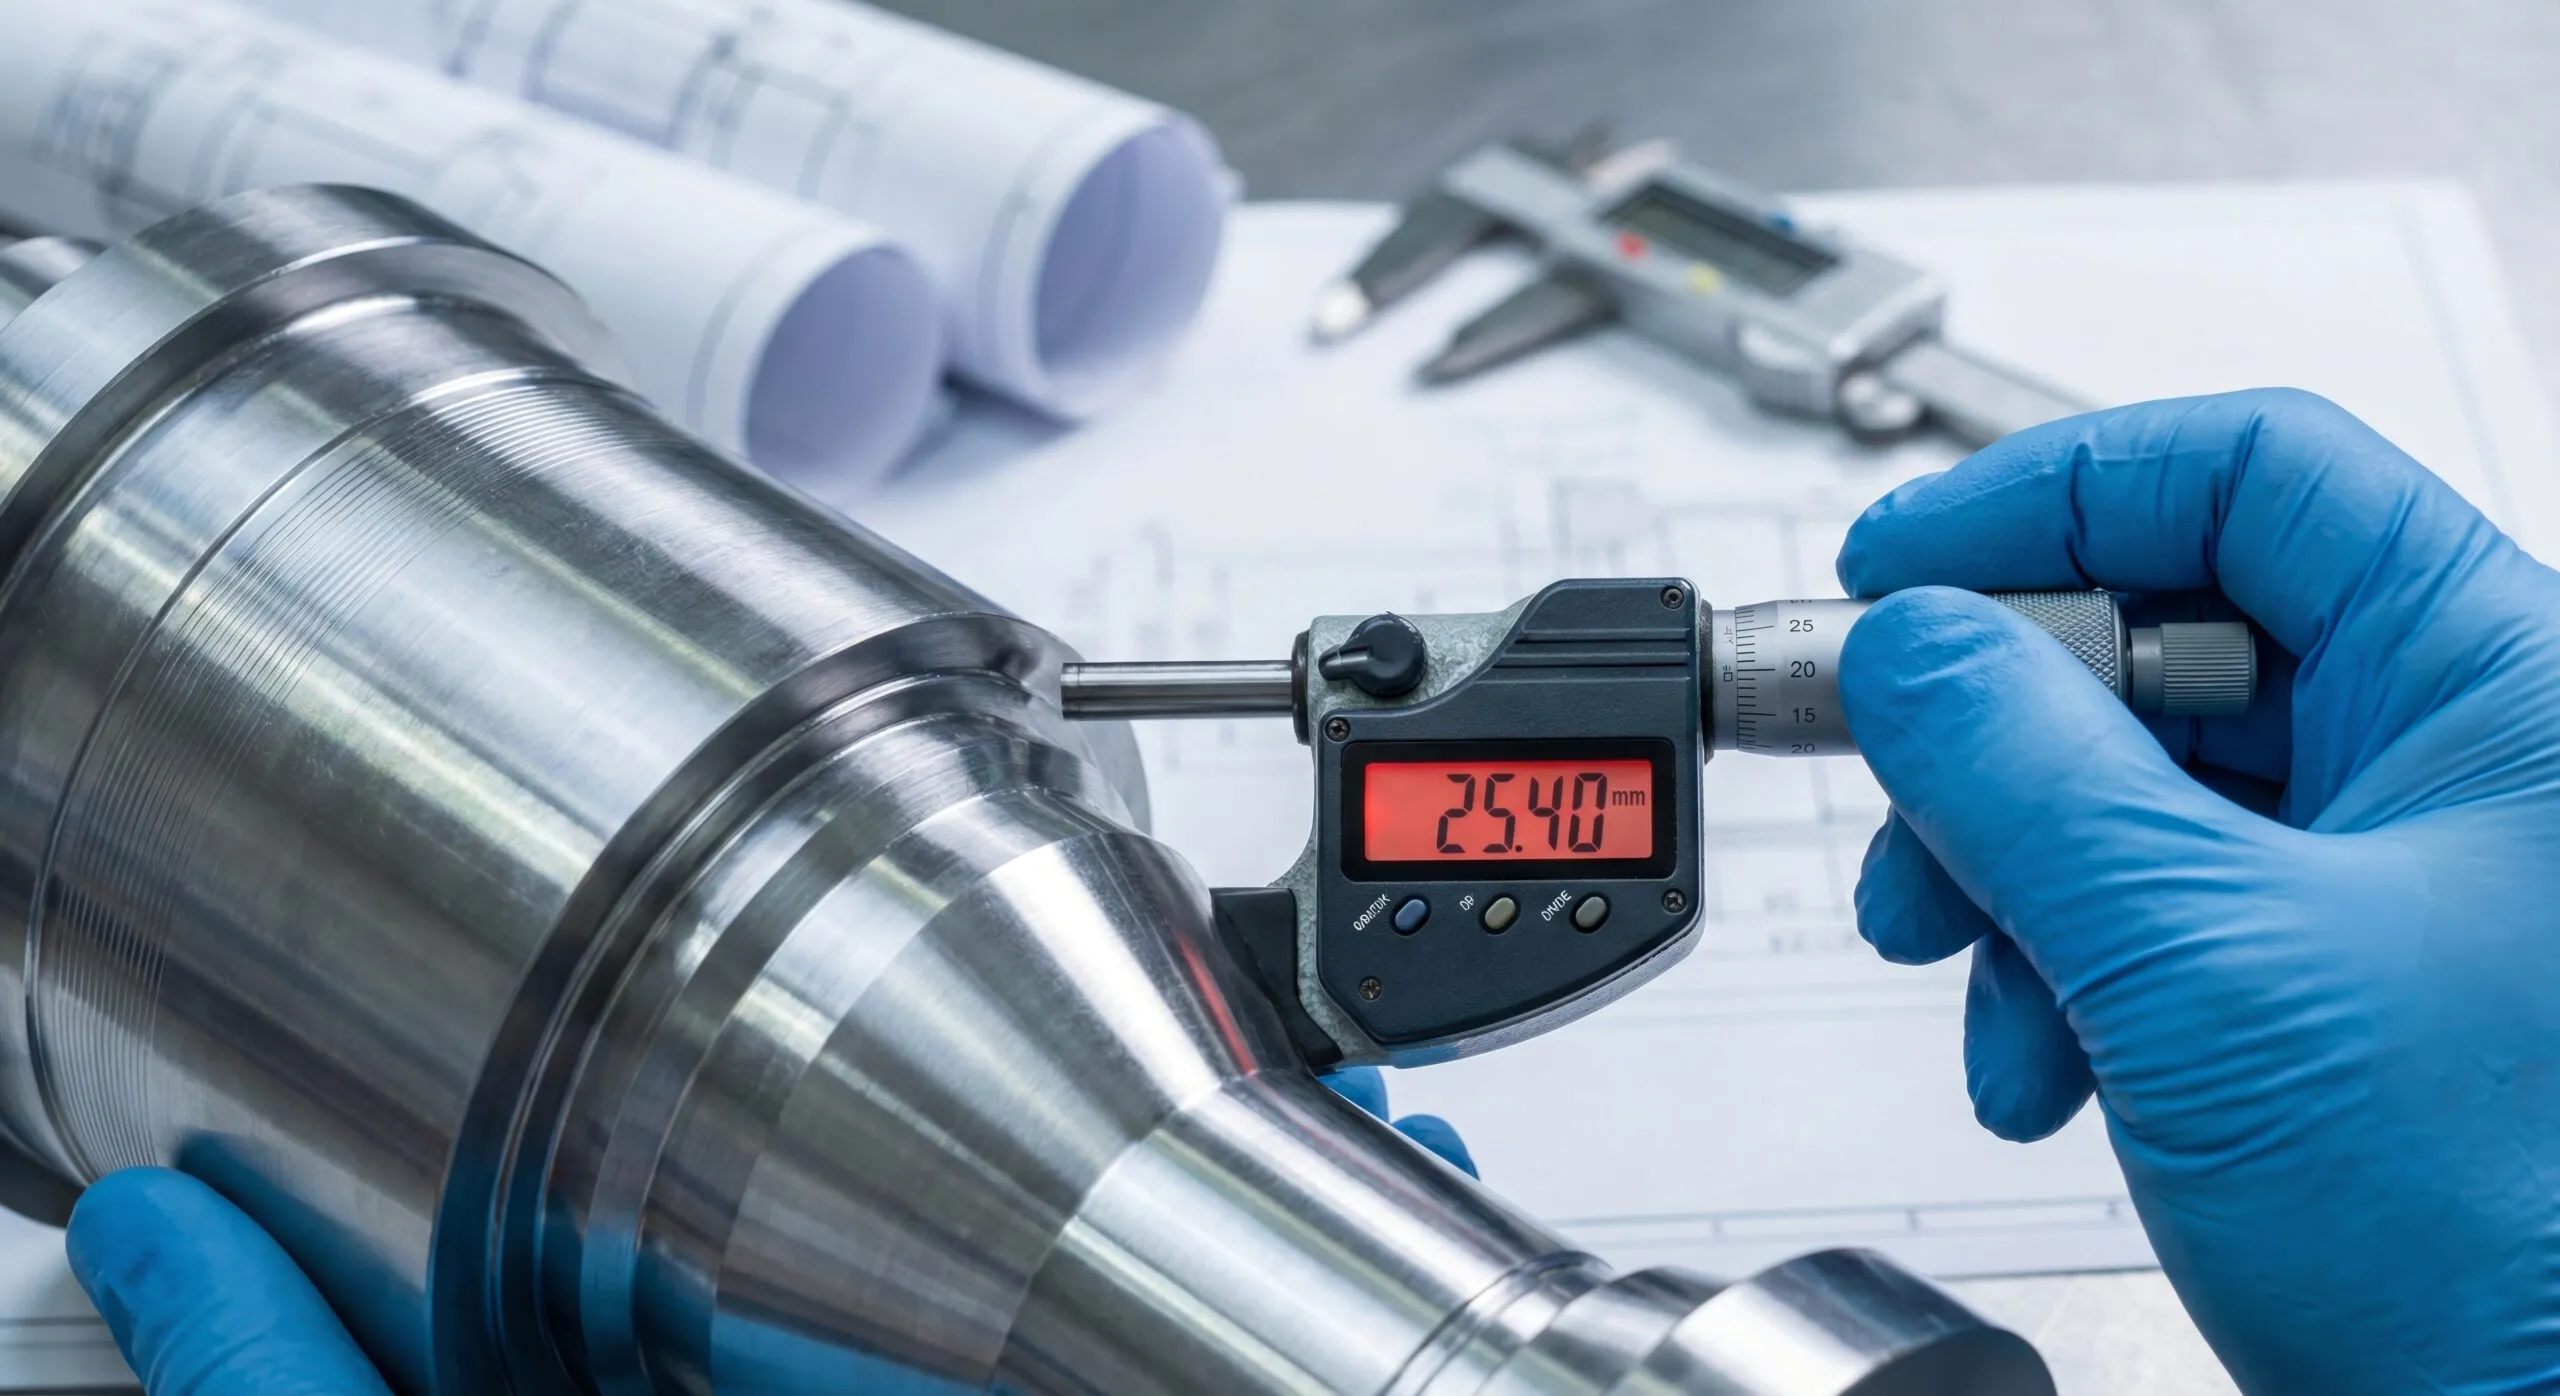
Before you can value a scanner, you have to honestly price what you do today. For most shops running calipers, micrometers, height gauges, and a manual or even bridge CMM, the cost of inspection is badly understated because so much of it is invisible. It hides in queue time, in the senior inspector who is the only person who knows how to fixture a tricky casting, and in the first-article reports that take a day and a half to produce by hand.
Consider a single complex part going through first-article inspection (FAI). Touching dozens or hundreds of dimensions point-by-point on a CMM, transcribing results, and building the report can consume the better part of a week of skilled labor. Across a production cycle with multiple part numbers, revisions, and re-inspections, it is common for manual inspection to absorb 30 or more man-days per cycle. That labor is not the whole story, though. The slower the inspection, the later you learn a process has drifted, and the more bad parts you’ve already made by the time you find out.
Direct labor: inspector hours per part, multiplied by parts and revisions.
Throughput drag: parts waiting in the QC queue instead of shipping or moving to the next operation.
Late detection: defects found at final inspection rather than at the operation that caused them.
Documentation overhead: manual report building, ballooning, and data entry that a structured workflow eliminates.
Tribal knowledge risk: inspection that only one or two people can perform, creating a single point of failure.
Write these down in dollars. Even rough figures expose how expensive “the way we’ve always measured” really is, and they become the baseline every line of the ROI model compares against.
A 3D scanner doesn’t return value through one big line item. It returns value through five distinct mechanisms, and a credible business case quantifies each one separately rather than leaning on a single headline number. Below, each component is broken out with the logic for estimating it.
This is usually the largest and easiest-to-defend bucket. A structured-light or laser system captures millions of points in seconds and compares the full part against CAD, instead of probing one feature at a time. Inspection tasks that took hours collapse into minutes, and the report is generated automatically inside the metrology software rather than typed up by hand. For full-part and free-form geometry, teams routinely see inspection time fall by 50% to 75%, and on the heavy first-article and re-inspection work, the savings of 30-plus man-days per cycle described above are very real.
To quantify it, take your current inspector hours per part, estimate the reduced hours with scanning, multiply the difference by your fully burdened labor rate, and scale by annual volume. Our metrology and 3D inspection services exist precisely because this math is so strong, and inspection-focused software like Geomagic Control X and PolyWorks|Inspector is where most of that automated reporting time savings comes from.
When inspection is fast and full-field, you stop sampling and start measuring everything, often. A scan-based first-article catches problems a point-probe sample misses, and in-process scanning surfaces drift while parts are still cheap to fix. The result is fewer defects escaping downstream, where correction is far more expensive. Across mixed manufacturing applications, moving from slow sampling to fast full-field inspection commonly cuts rework by up to 50%.
Value this bucket by estimating your current annual rework cost, then applying a conservative reduction percentage. Don’t claim the maximum; a defensible model uses something like a 20% to 35% reduction and notes the upside. The mechanism is simple and worth stating plainly to leadership: earlier detection means you fix processes, not finished goods.
Scrap is rework’s more expensive sibling: parts so far out of tolerance they can’t be saved, plus the machine time and material already invested in them. The same early-detection effect that cuts rework cuts scrap, because a process caught drifting at operation three doesn’t produce a hundred unsalvageable parts by operation seven. For high-value materials such as titanium, specialty alloys, or large castings, a single avoided scrap event can fund a meaningful slice of the scanner itself.
Estimate annual scrap value (material + invested labor and machine time).
Apply a conservative reduction from earlier, more frequent detection.
Weight it toward your highest-value parts, where the savings concentrate.
For shops inspecting large or heavy parts, an automated approach such as the Digitize Designs RM-300 automated inspection workstation can make frequent in-process scanning practical, turning scrap reduction from a theory into a routine.
Scanning isn’t only a quality tool. In product development and reverse engineering, the ability to capture a physical part and convert it to editable CAD compresses the design loop dramatically. Instead of manually measuring a prototype, a legacy part with no drawings, or a hand-modified tool, you scan it and bring accurate geometry straight into CAD. For reverse engineering and iterative design work, production and modeling time reductions of up to 75% are common on the right applications.
Faster iteration has a financial value beyond labor: it shortens time-to-market and frees engineering capacity for more revisions in the same window. Tools like Geomagic Design X and QuickSurface turn scan data into parametric, feature-based models, and our reverse engineering services deliver the same outcome when you’d rather buy the result than the workflow.
Many manufacturers send parts out for dimensional inspection, reverse engineering, or third-party metrology, paying per-part fees, shipping high-value components, and absorbing turnaround delays. Others fly engineers to supplier or field sites to measure parts in person. Bringing scanning in-house collapses both. The recurring outsourcing spend becomes an internal capability, and portable systems let you measure on the floor or at a customer site instead of crating parts and waiting days for a report.
To value this, total your annual outsourced inspection and reverse-engineering invoices, plus the loaded cost of any inspection-related travel. Even a modest in-house capture rate against that spend is often enough to cover the scanner’s annual cost on its own.
Published, named case-study figures vary widely by industry, part complexity, and volume, so rather than borrow numbers we can’t stand behind for your situation, here are the typical, illustrative ranges these five components tend to fall in. Treat them as starting assumptions to challenge with your own data, not as guarantees.
ROI component Typical illustrative impact How to size it for your shop Inspection labor 50%–75% time reduction; 30+ man-days saved per heavy inspection cycle Hours saved/part x burdened rate x annual volume Rework Up to 50% reduction (model conservatively at 20%–35%) Annual rework cost x reduction % Scrap Meaningful reduction, concentrated in high-value parts Annual scrap value x reduction % Design iteration Up to 75% faster on reverse-engineering / iterative work Engineering hours saved x rate + time-to-market value Outsourcing & travel Largely eliminated for in-house-capable work Annual outsourced spend + loaded travel cost
The point of separating them this way is credibility. When a finance reviewer can see five independent levers, each with its own conservative assumption, the case survives scrutiny far better than a single optimistic percentage ever would.
Here is a worked example you can copy. The inputs are illustrative; replace every figure with your own. This is the calculator concept in long form. The same logic drops cleanly into a spreadsheet with one row per component.
Set the investment. Scanner, software, fixturing, and training. Example: a $55,000 all-in first-year investment for hardware, inspection software, and onboarding.
Quantify labor savings. Say you run 600 inspection events a year, currently averaging 4 hours each, dropping to 1 hour with scanning. That’s 3 hours saved x 600 = 1,800 hours. At a burdened rate of $65/hour, that’s $117,000.
Quantify rework reduction. Current annual rework cost of $90,000, reduced a conservative 25%: $22,500.
Quantify scrap reduction. Current annual scrap of $120,000, reduced a conservative 15%: $18,000.
Quantify iteration/engineering savings. Reverse-engineering and design work where scanning saves an estimated 500 engineering hours/year at $80/hour: $40,000 (excluding harder-to-price time-to-market gains).
Quantify avoided outsourcing/travel. $35,000 in outsourced inspection and reverse engineering brought in-house, capturing 70%: $24,500.
Sum annual benefit. $117,000 + $22,500 + $18,000 + $40,000 + $24,500 = $222,000 in year-one benefit.
Subtract ongoing costs. Annual software maintenance, calibration, and a fraction of an operator’s time, say $18,000, for a net first-year benefit of $204,000.
Compute ROI and payback. Net benefit ÷ investment = $204,000 ÷ $55,000 ≈ 3.7x first-year ROI. Payback ≈ $55,000 ÷ ($204,000 ÷ 12) ≈ 3.2 months.
Even if you halve every benefit assumption to be deliberately pessimistic, the model still pays back inside a year in this example. That asymmetry, large upside with defensible downside, is exactly what a strong capital case looks like. If you’d like help pressure-testing your own inputs against real part data, our 3D scanning services team can run a representative part and ground the model in measured numbers.
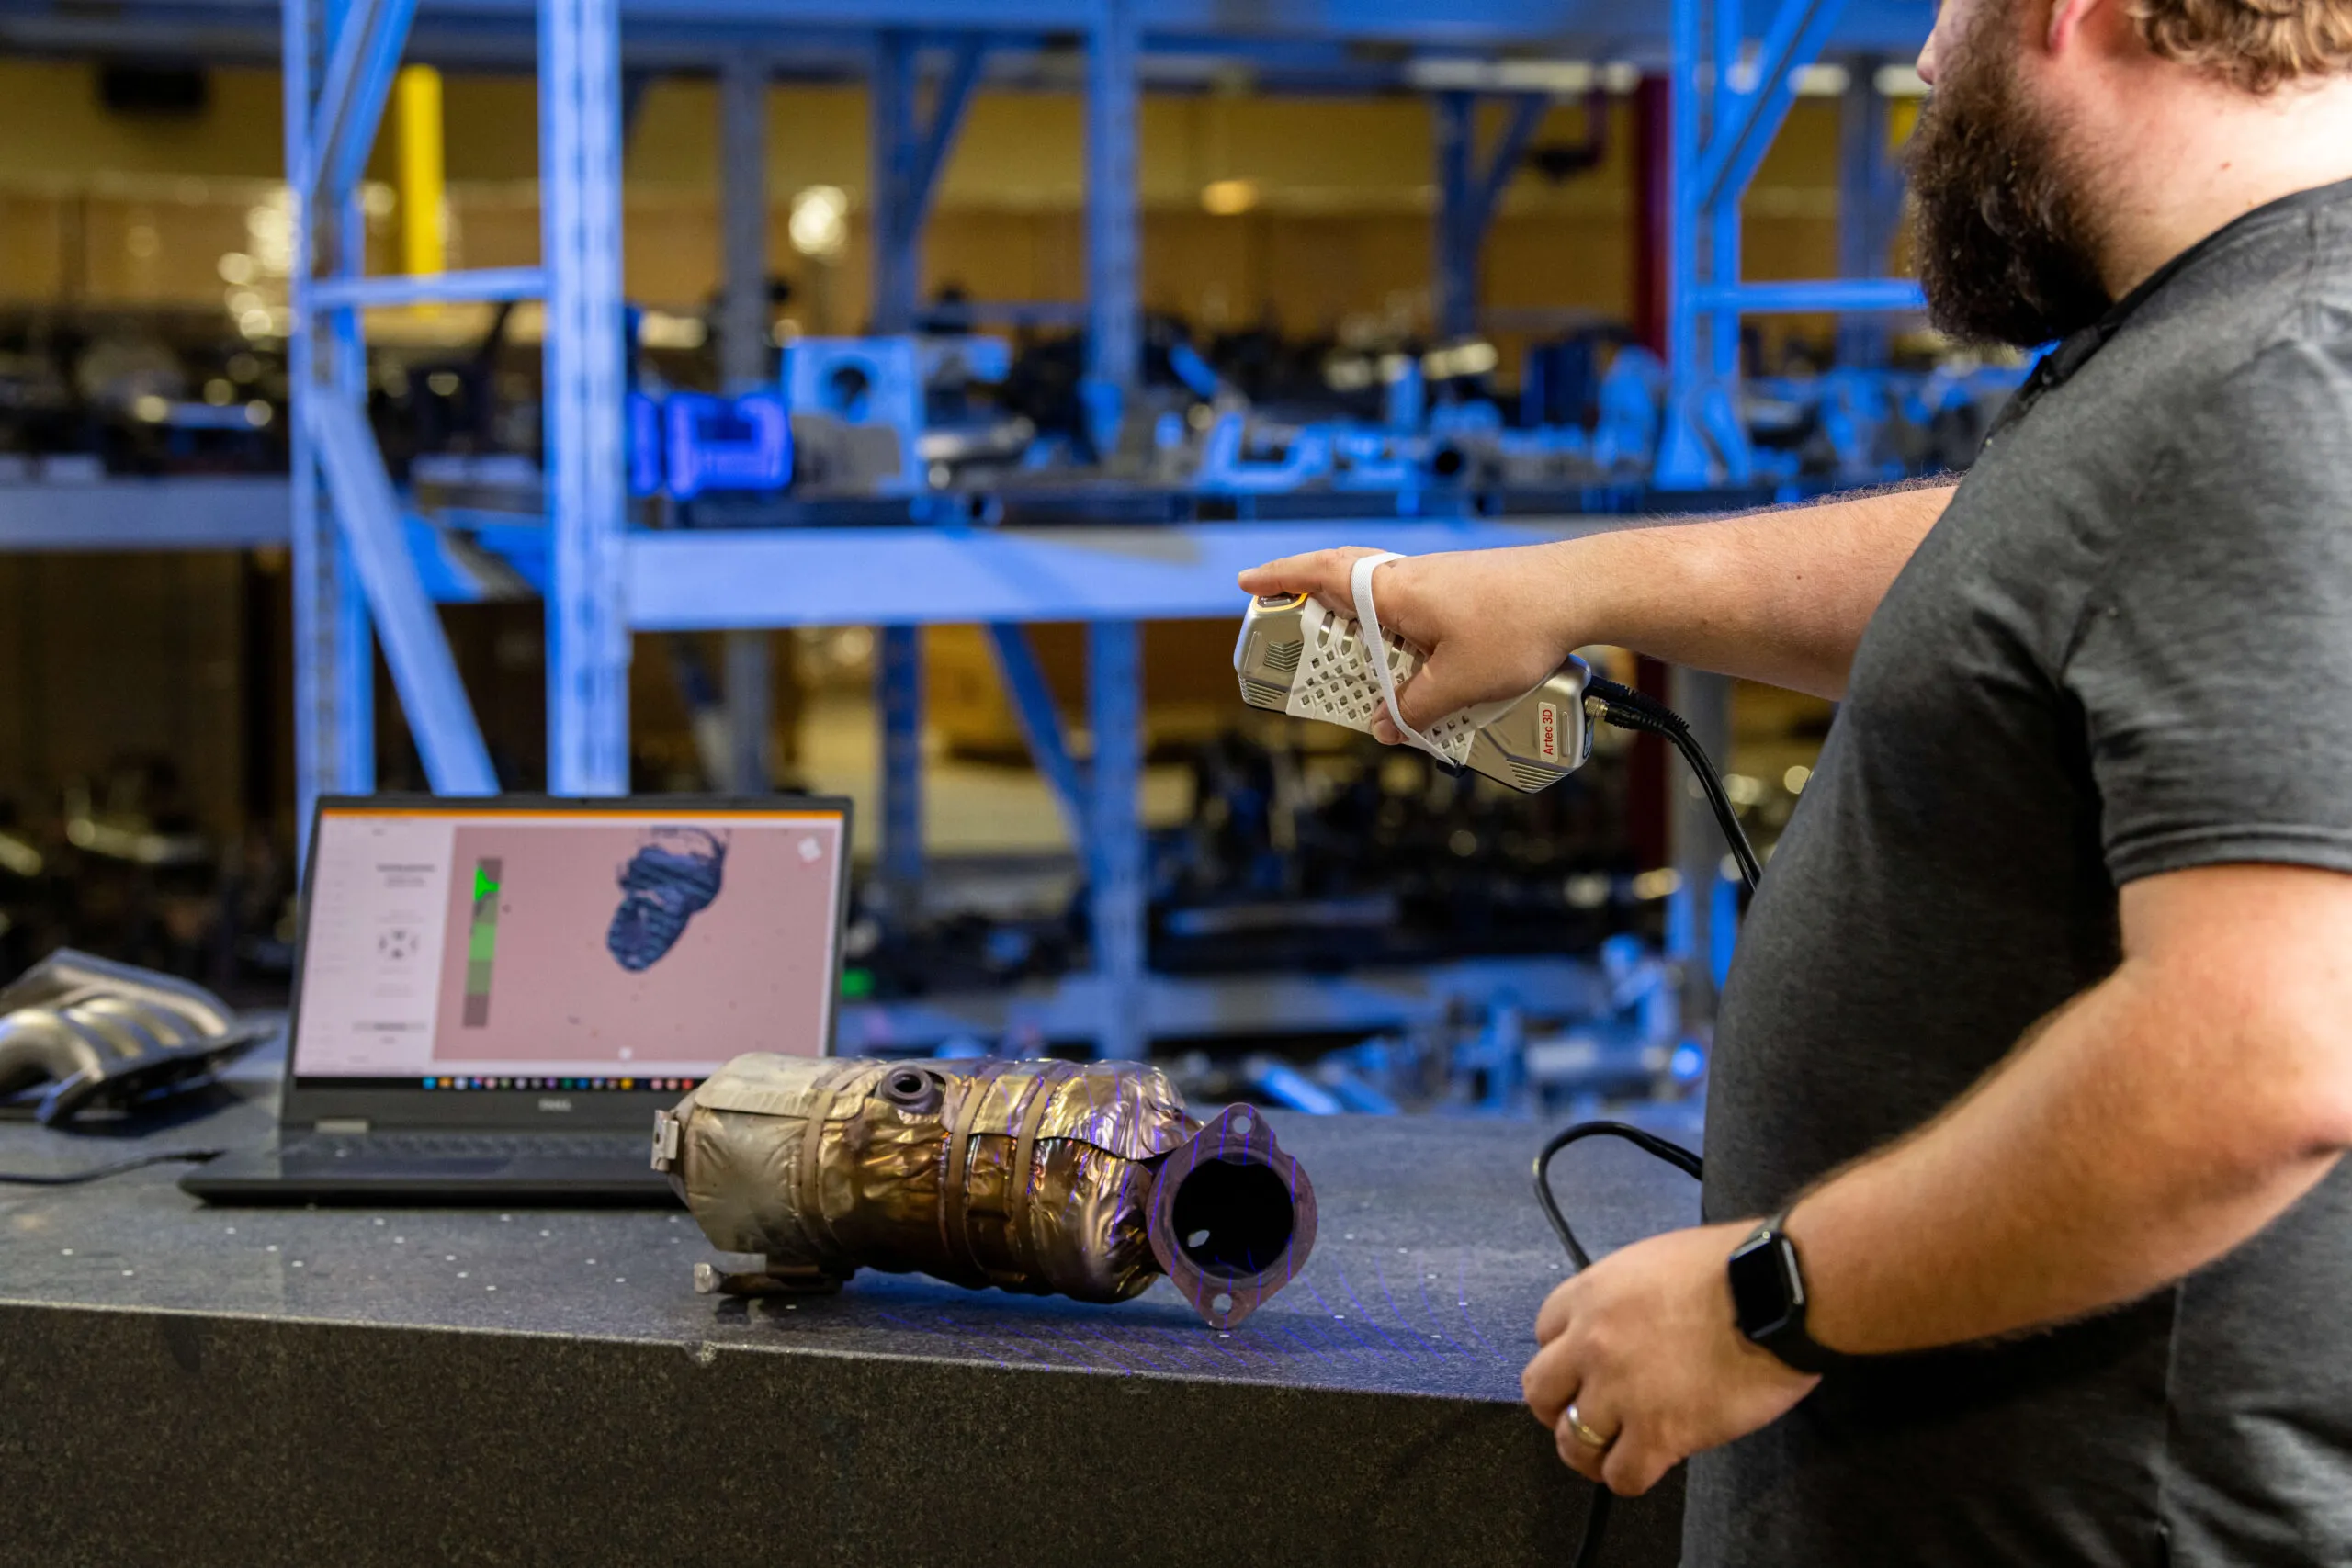
Payback period is the single number most leaders anchor on, and it varies with how inspection-heavy your operation is. The more parts, the more complex the geometry, and the higher your material costs, the faster the scanner pays for itself. A high-mix, high-complexity shop measuring expensive parts can break even in a quarter or two. A lower-volume operation will take longer but still typically lands inside the first year.
High inspection volume + high-value materials: payback often in 3–6 months.
Moderate volume, mixed materials: payback commonly in 6–12 months.
Lower volume, occasional reverse engineering: payback in 12–18 months, often accelerated by avoided outsourcing.
One nuance worth raising with finance: the labor and outsourcing savings are recurring and compounding, while the investment is largely one-time. After payback, nearly the entire annual benefit drops to the bottom line. That structural fact, a fixed cost buying a permanent reduction in variable cost, is more persuasive than any single ROI multiple.
A model that ignores the soft costs loses credibility the moment a skeptical reviewer finds the gap. Include these explicitly, both because honesty strengthens the case and because budgeting for them is what makes the projected returns actually materialize.
Software and maintenance: annual licenses or maintenance for inspection and scan-to-CAD tools, plus periodic recalibration.
Training and ramp time: operators need real proficiency before they hit the productivity numbers. Budget the learning curve, and consider structured GD&T training so inspection results are interpreted correctly.
Fixturing and consumables: simple fixturing for repeatable setups, plus scanning spray for shiny, dark, or transparent surfaces.
Right-sizing the hardware: a small-parts, high-resolution job and a large-assembly job may call for different systems. Browsing portable and handheld 3D scanners alongside industrial scanners for manufacturing helps match the tool to the work before you commit.
Integration time: connecting scan data to your CAD, PLM, or quality systems so results flow instead of sitting in folders.
None of these break the business case. They simply move it from a back-of-envelope estimate to a number leadership can trust, and a trusted, conservative number gets approved far more often than an aggressive one.
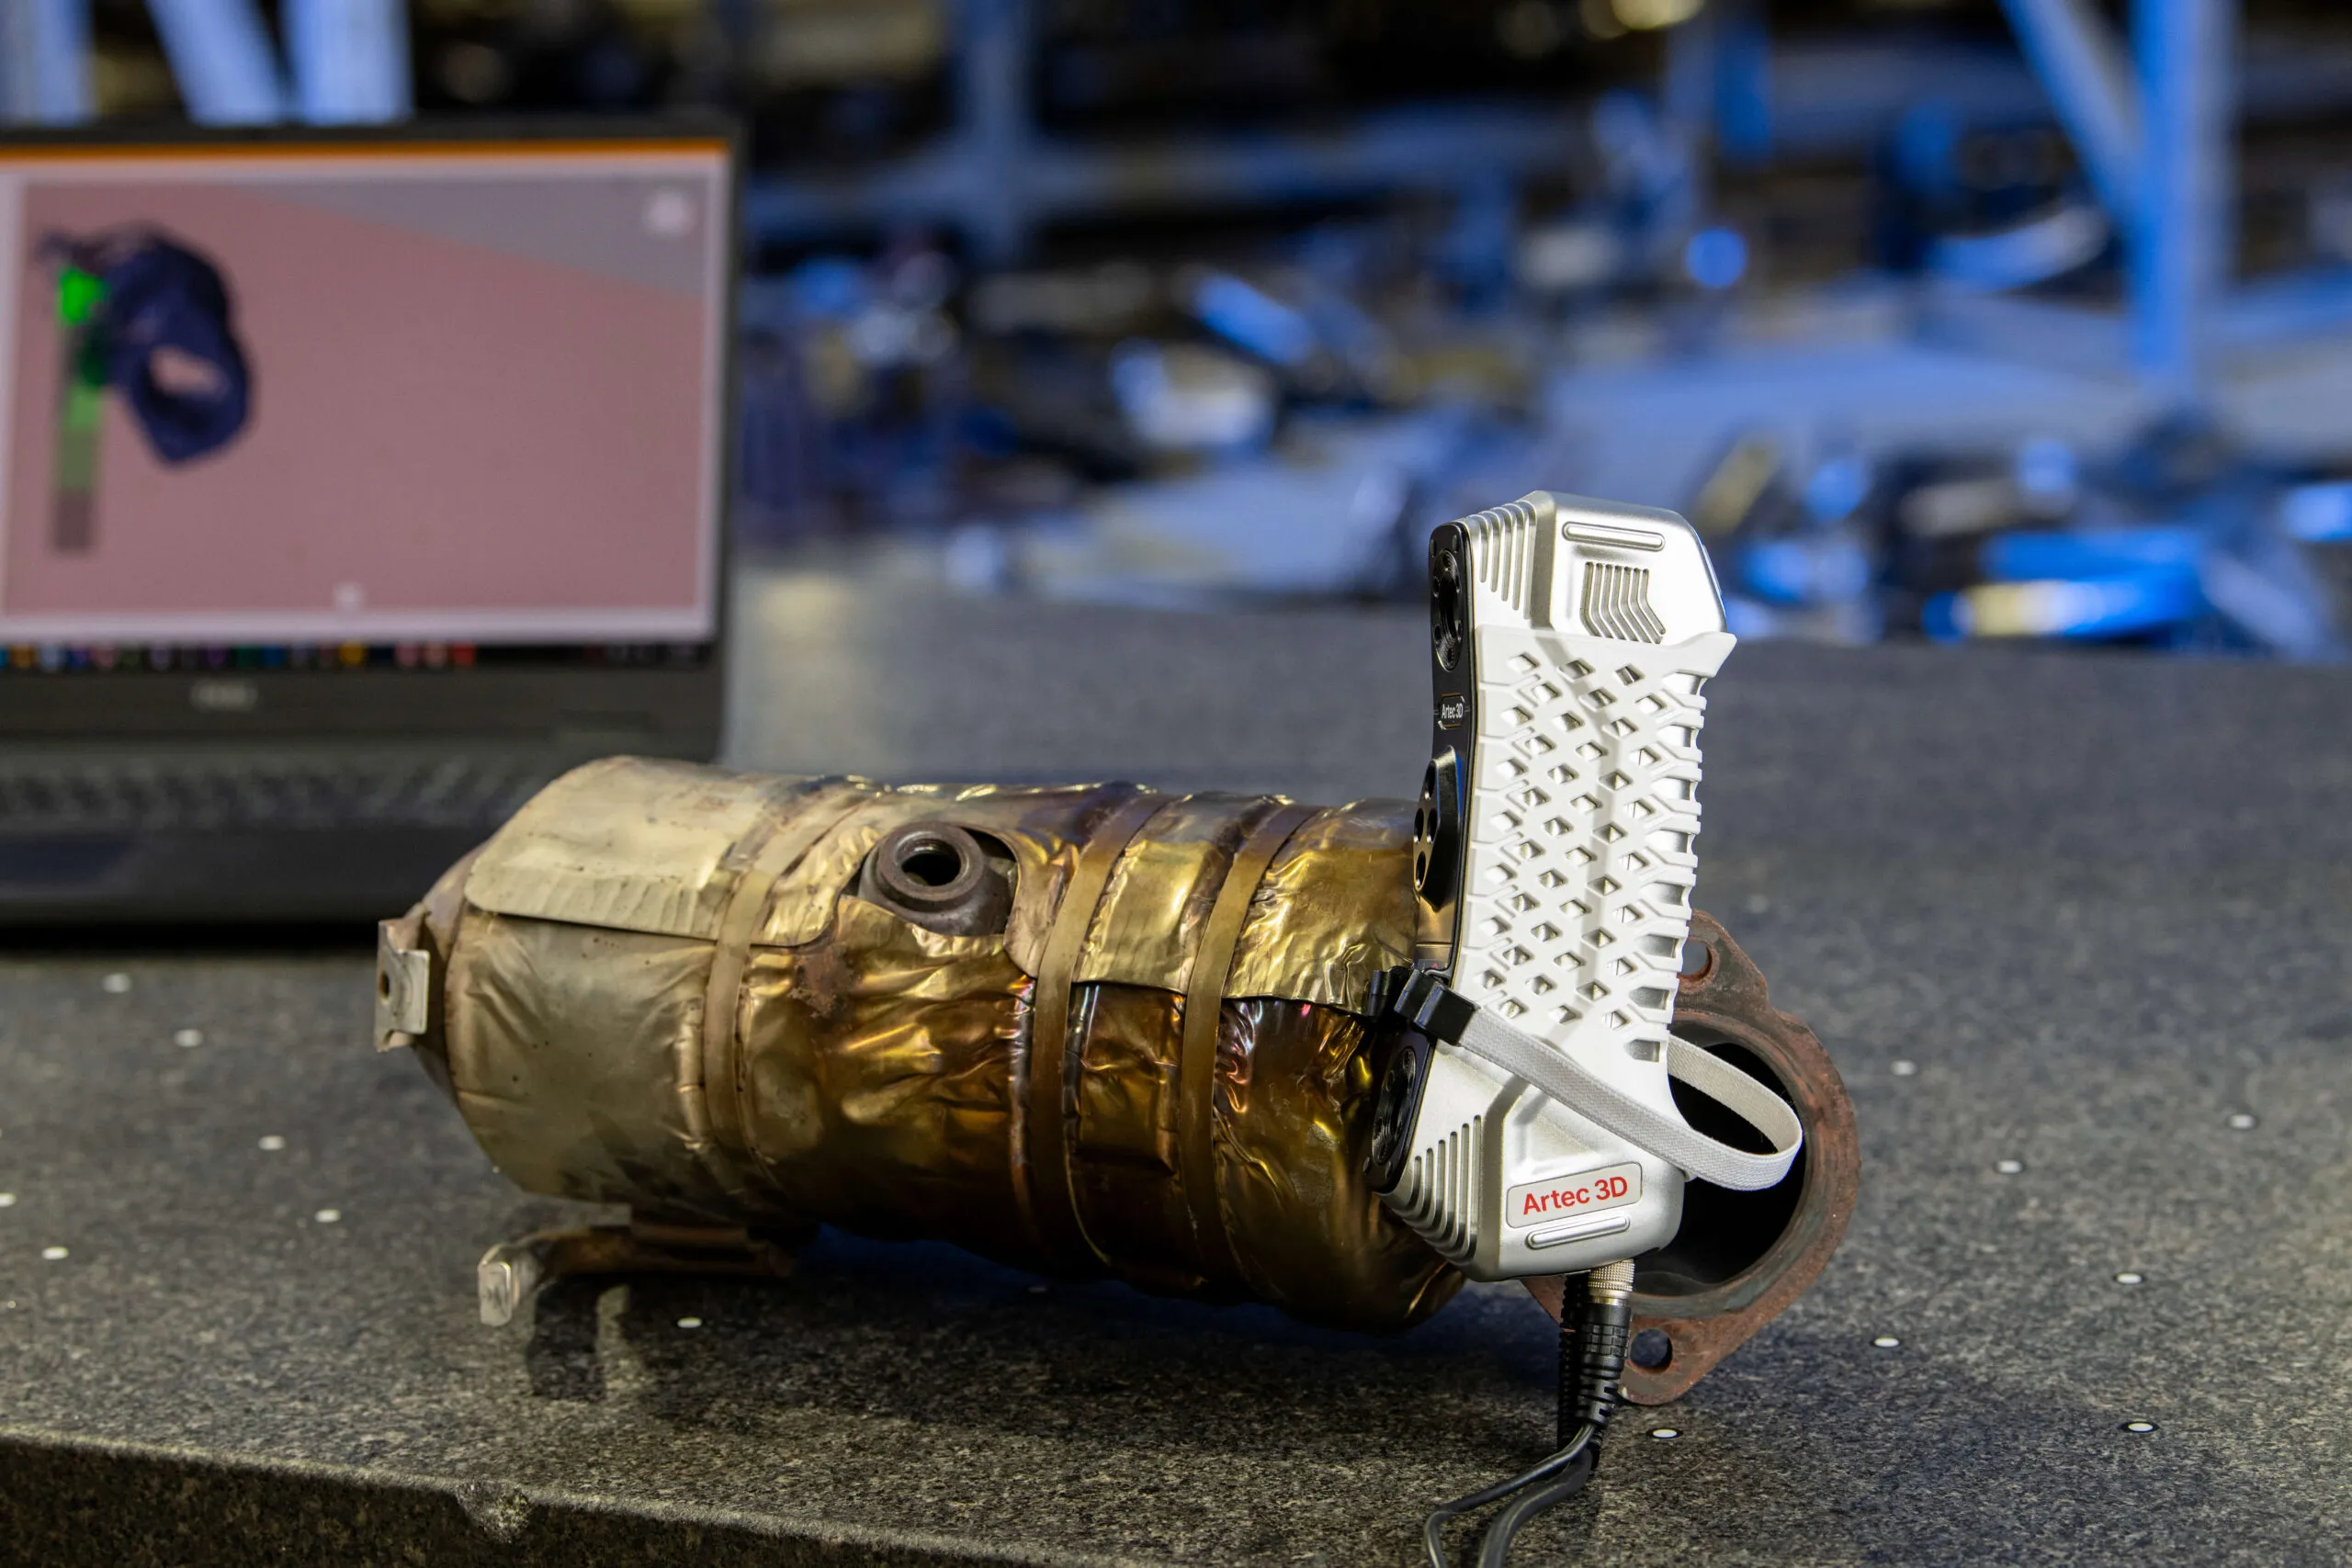
Engineers tend to sell scanners on capability: accuracy in microns, point density, scan speed. CFOs and ops directors don’t buy capability. They buy outcomes. Translate every spec into a financial or operational result. “25–50 micron accuracy” becomes “we catch process drift before it makes scrap.” “Full-field capture in seconds” becomes “first-article reports in an afternoon instead of a week.” The framework above does this translation for you, component by component.
Lead with the conservative scenario, show the upside as a separate line, and frame the recurring savings against the one-time cost. Bring one representative part, ideally scanned and reported during an evaluation, so the numbers are grounded rather than hypothetical. And pre-empt the obvious objections (training time, software cost, integration) by having already budgeted for them. When the request arrives with the hidden costs named and the payback still landing inside a year, the conversation shifts from “should we?” to “which system?”
Building the ROI case is easier with real data and an honest sounding board. At Digitize Designs, our engineers help manufacturers right-size a scanner to the work, model the return against actual part volumes and costs, and prove it out on representative parts before any purchase. Whether you ultimately bring scanning in-house or lean on our metrology and inspection services, the goal is the same: measurable savings you can defend to leadership.
If you’re weighing a 3D scanner investment and want to ground the numbers in your own operation, contact us for a consultation or quote. We’ll help you scan a sample part, build a model that survives finance review, and choose the system that delivers the strongest return for your manufacturing environment.
You have a part on the bench and no drawing for it. Or you have the drawing, and now you
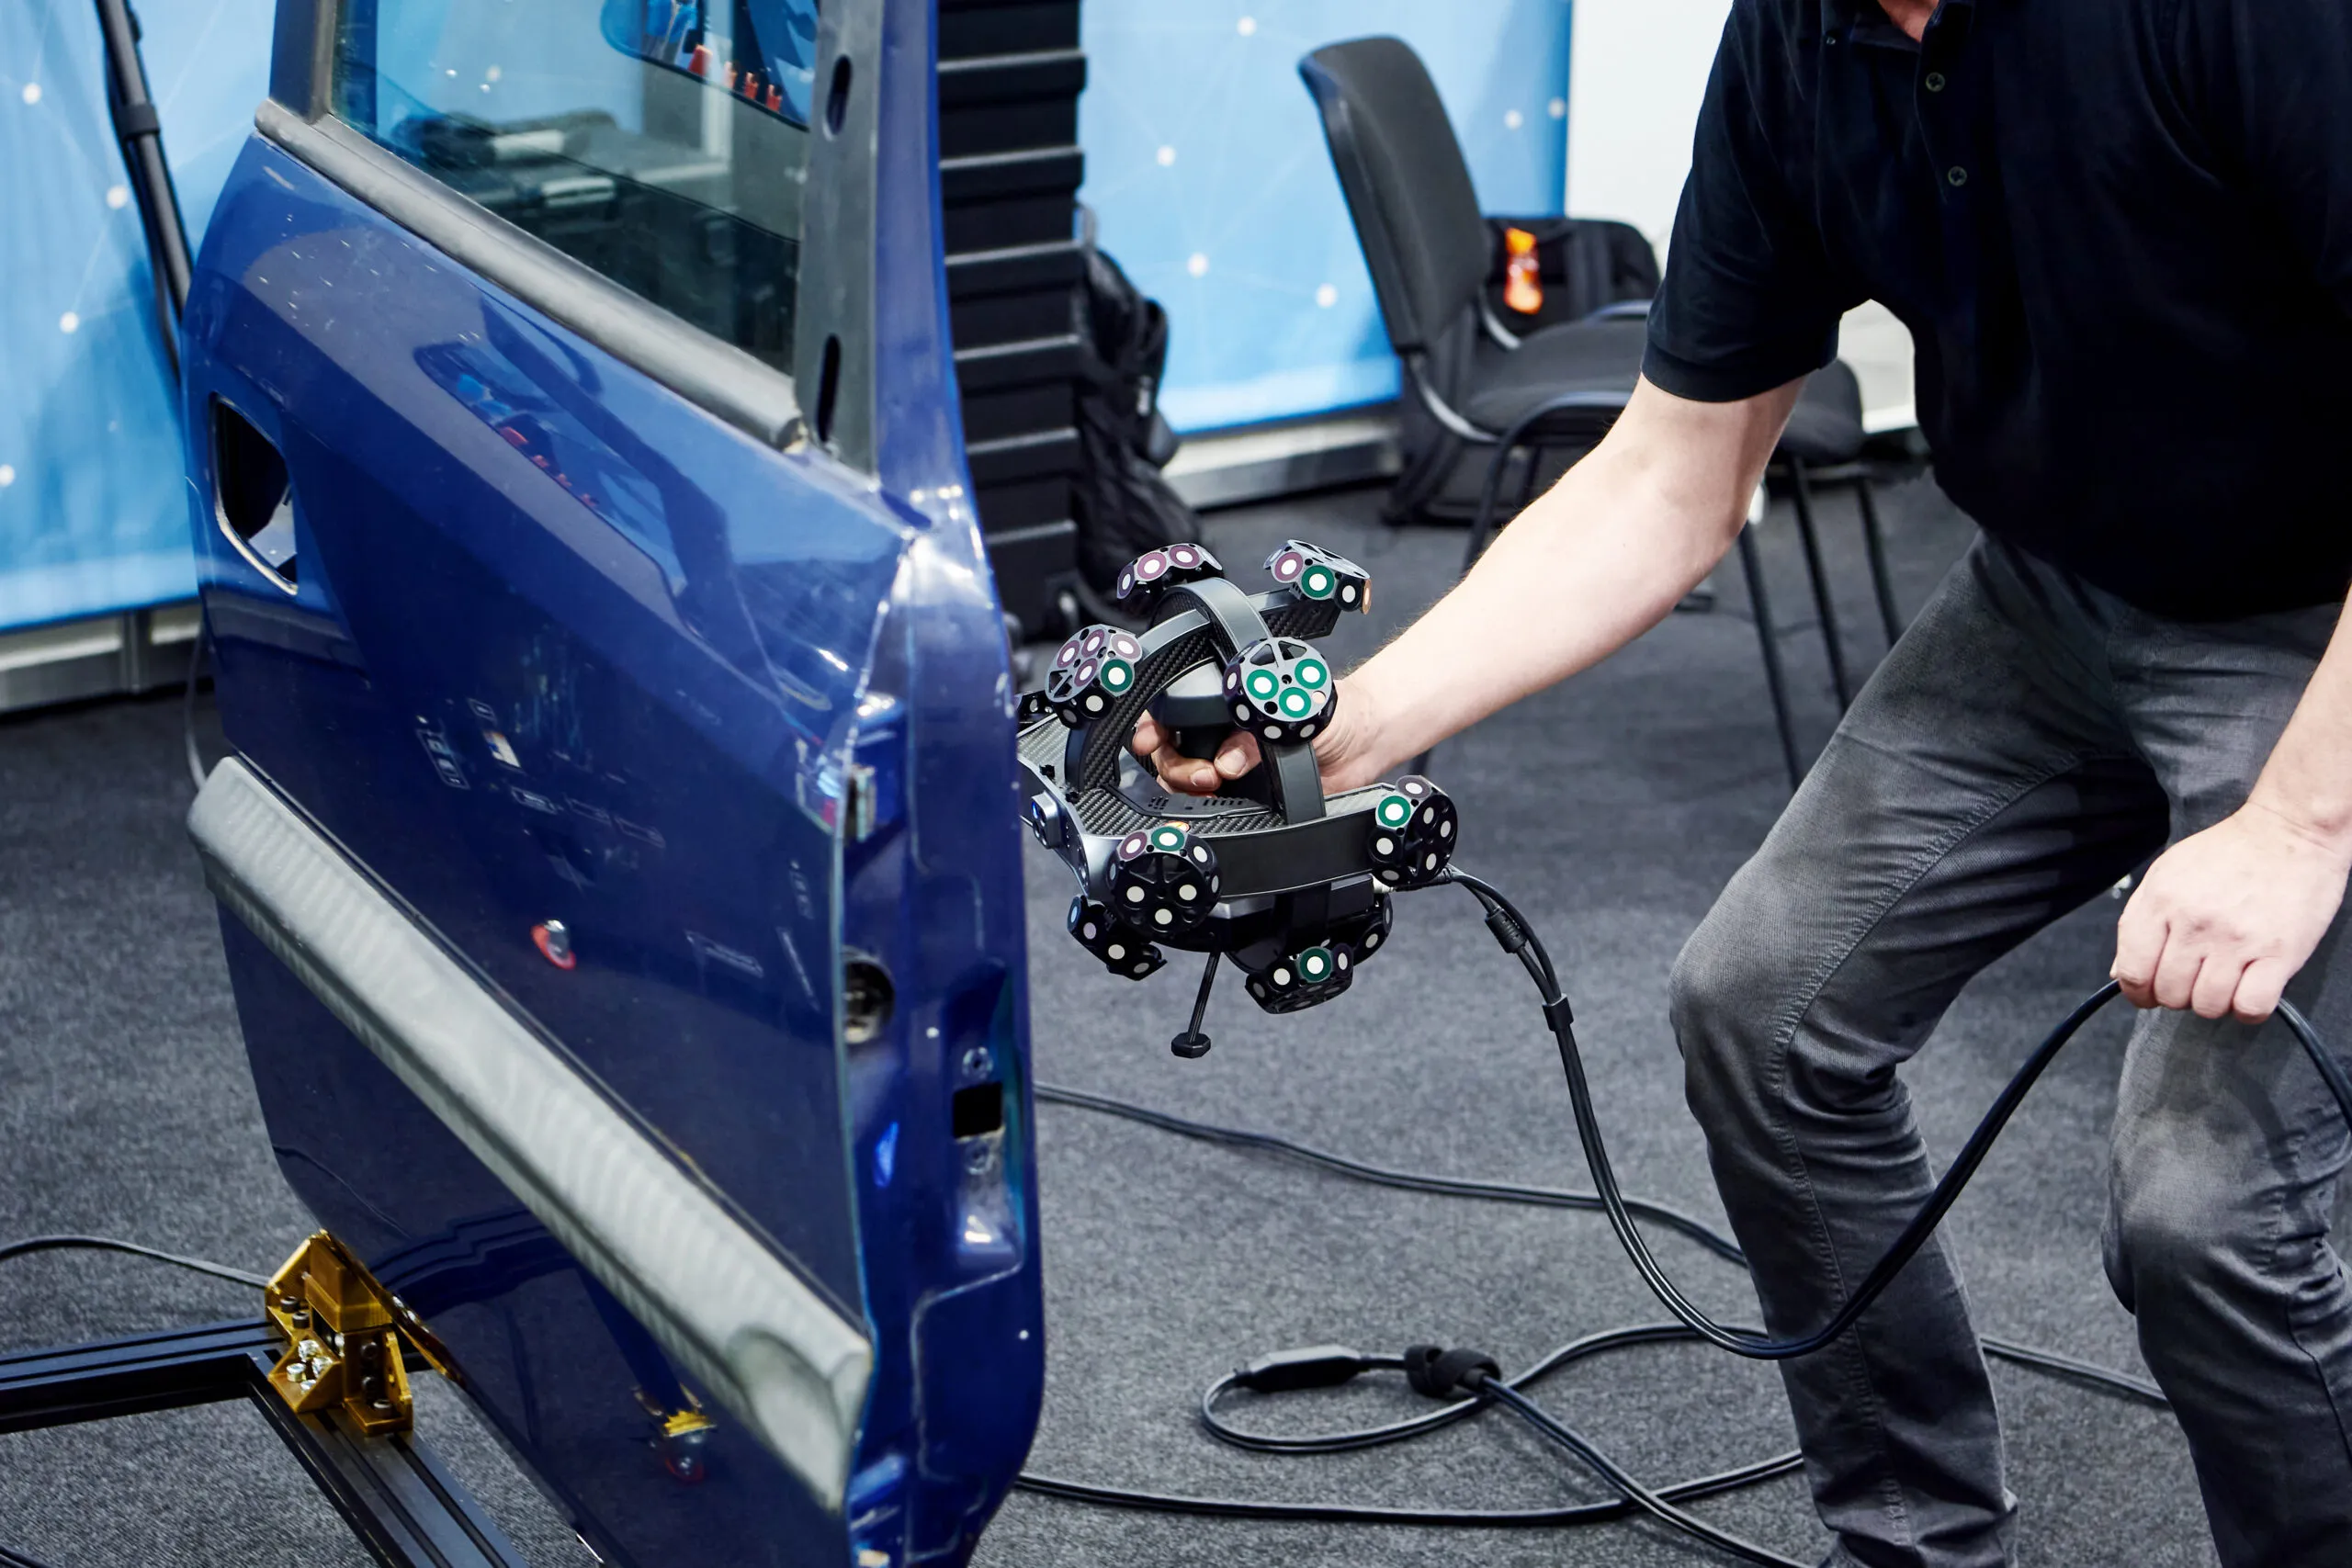
A fender comes off the press and something is off. The hole pattern checks out on the CMM and every

For most of the twentieth century, a crime scene was preserved with a tape measure, a roll of film, and
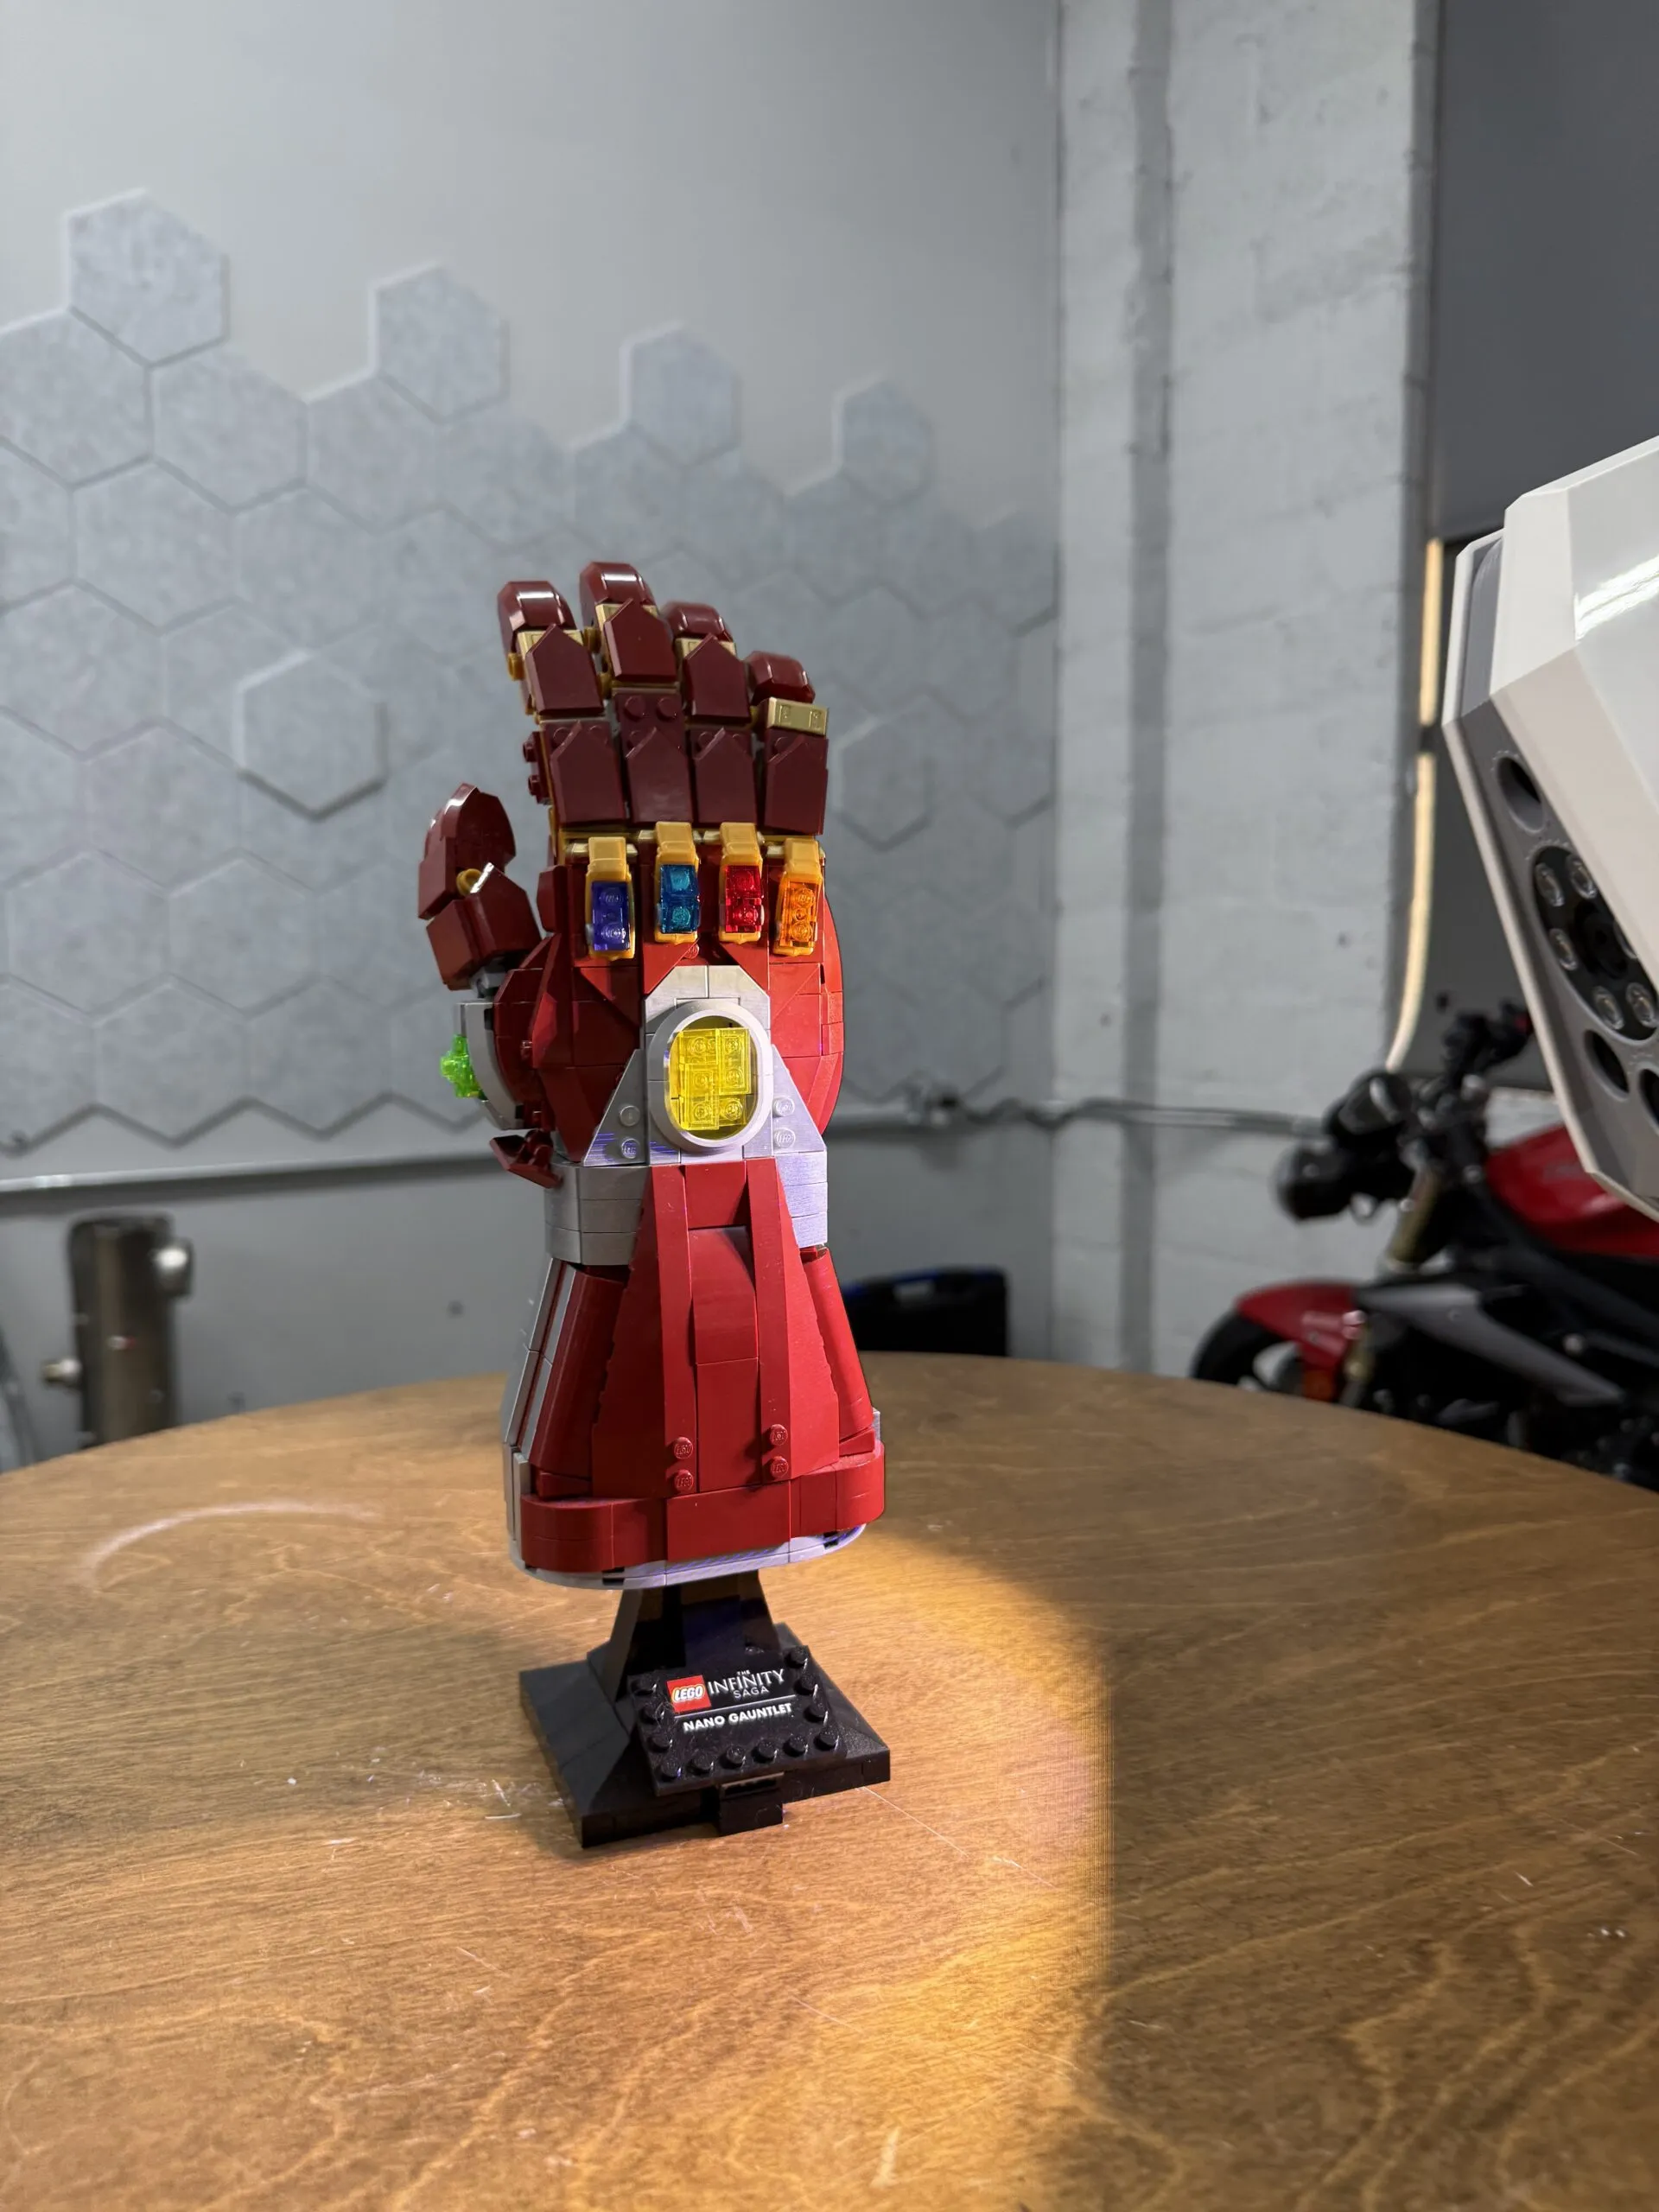
If you have ever searched for a way to turn a physical object into a digital model, you have probably