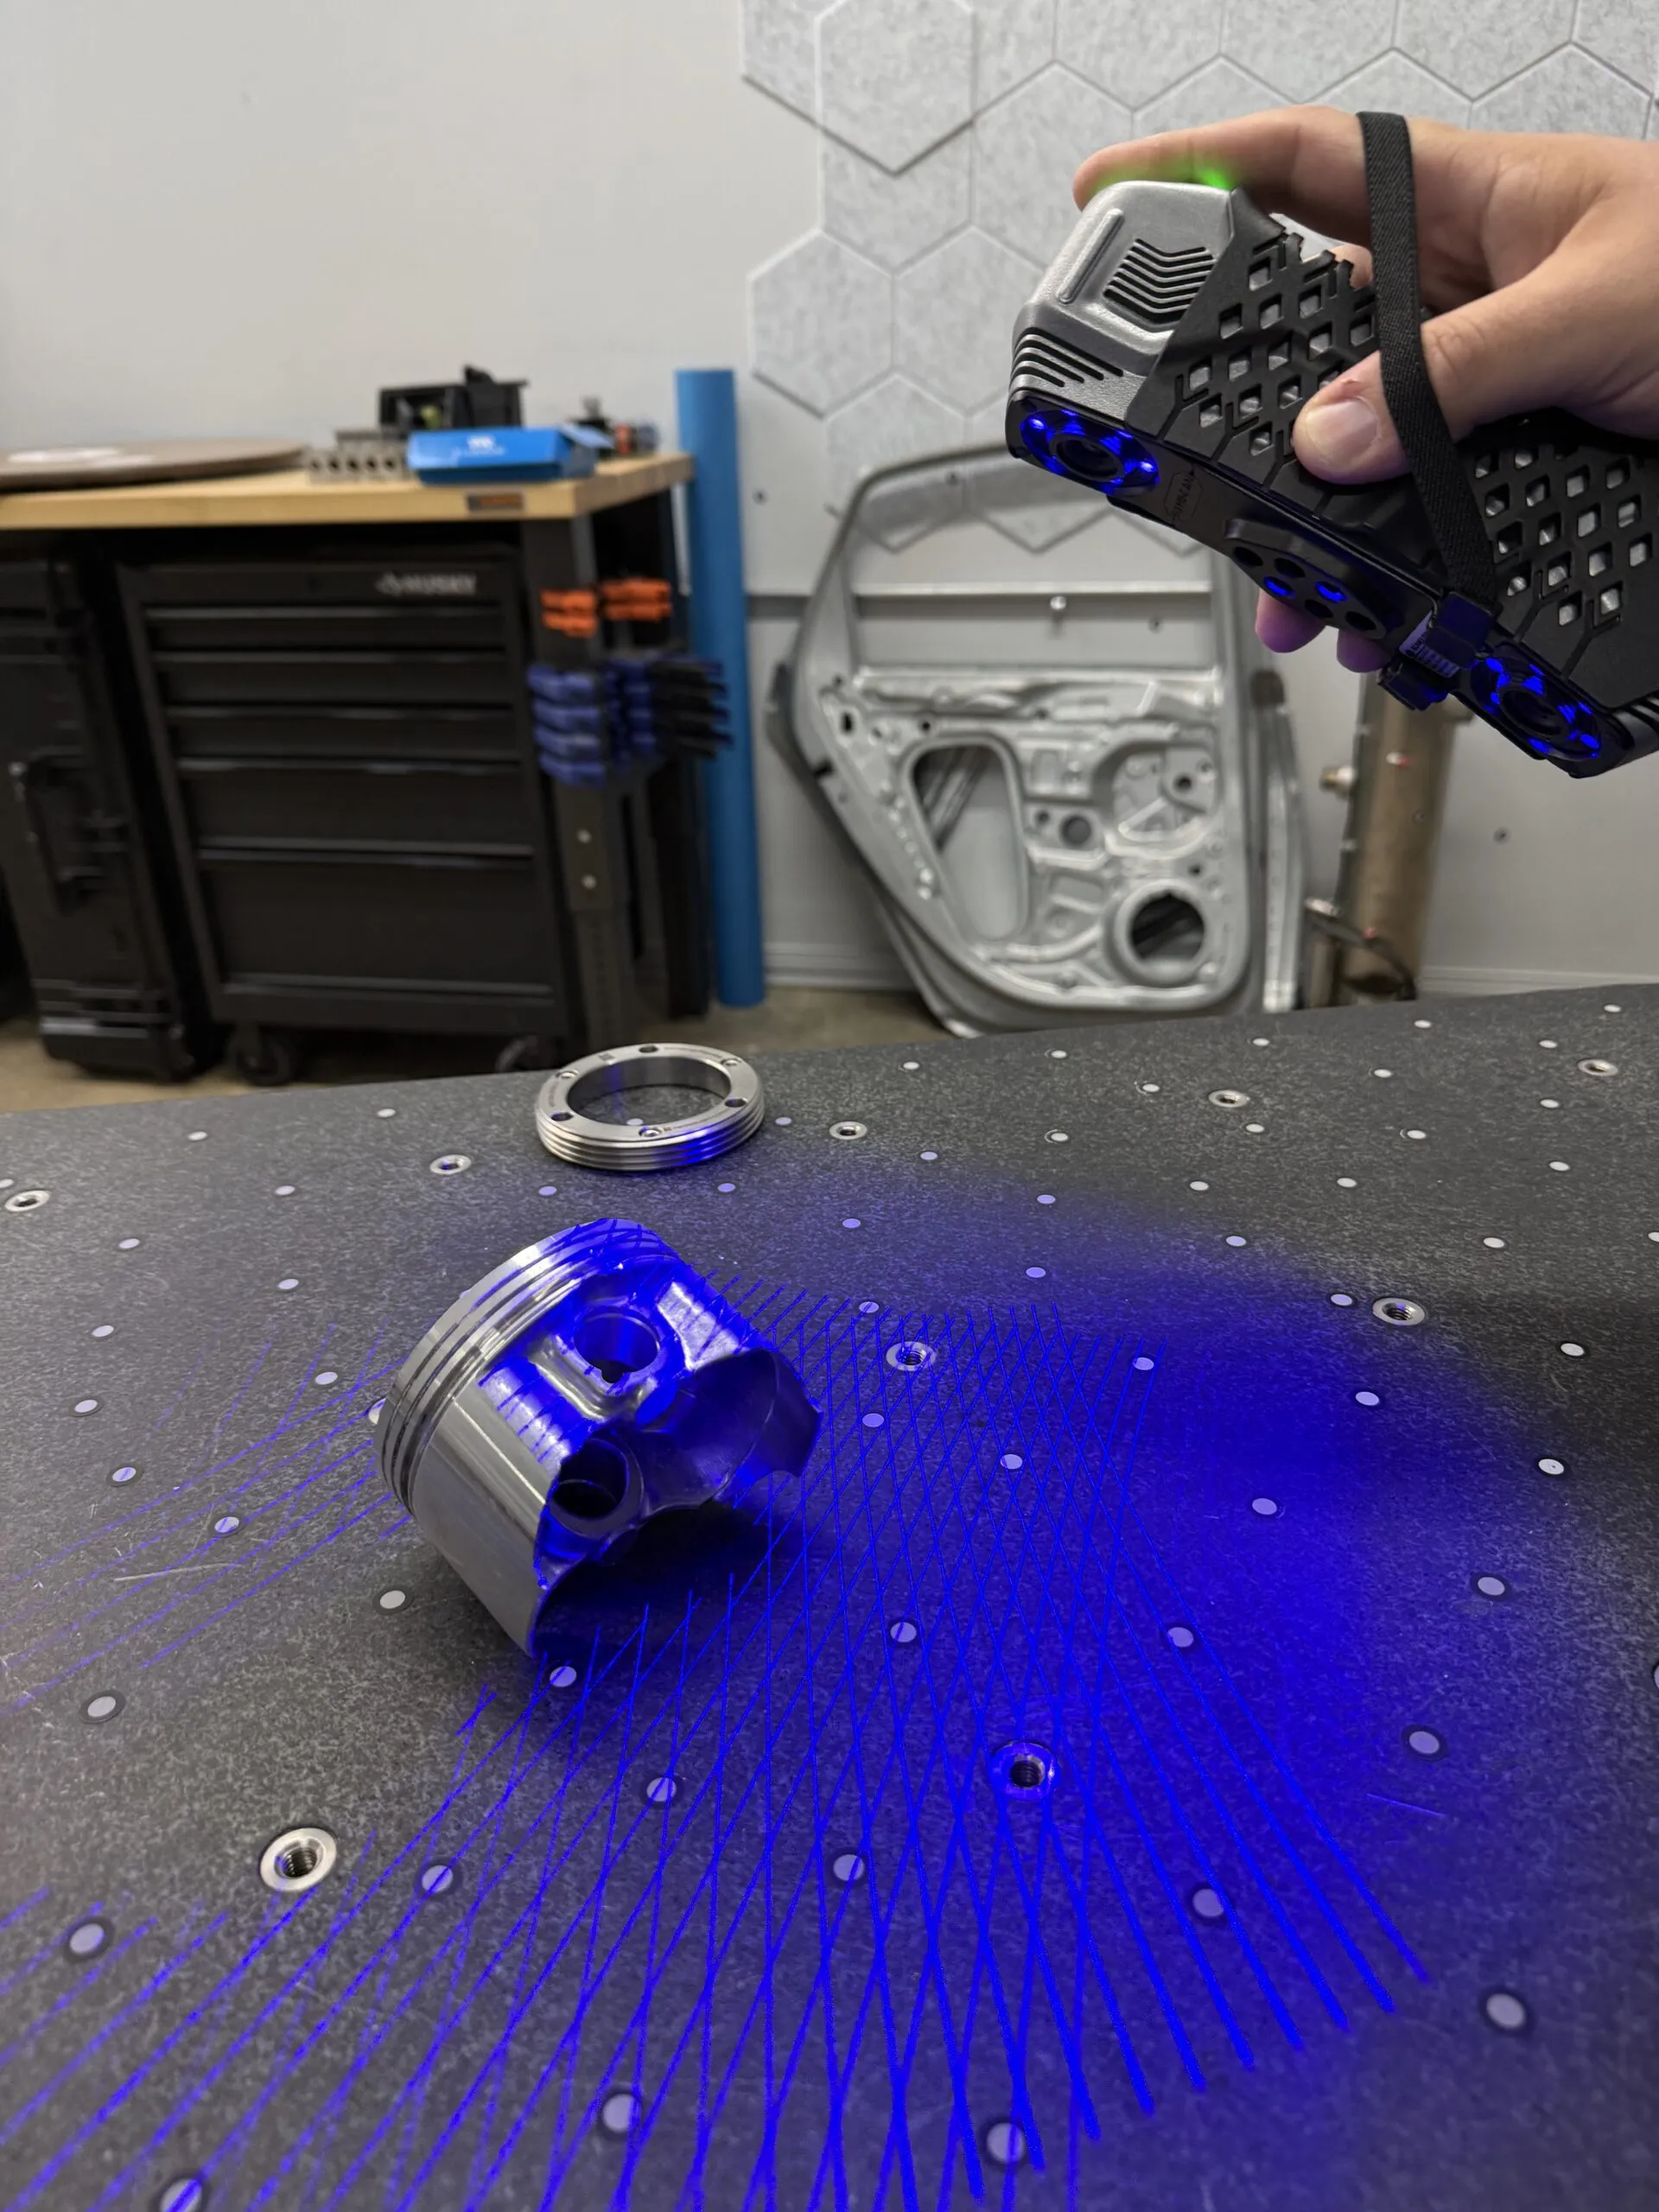
How Does 3D Scanning Work? A Beginner’s Guide to the Technology
You have a part on the bench and no drawing for it. Or you have the drawing, and now you

A coordinate measuring machine touches a handful of points and reports a number. A 3D scanner captures millions of points across the entire surface, then asks a harder question: which of those points actually define the datum, the feature, and the tolerance zone you care about? Extracting reliable GD&T from 3D scanning measurement is less about the scanner and more about the decisions you make between the point cloud and the inspection report. Get the alignment, feature extraction, and uncertainty handling right, and scan-based GD&T rivals a CMM while covering far more of the part. Get them wrong, and you will produce confident numbers that are quietly incorrect.
This guide is written for engineers and quality professionals who already understand geometric dimensioning and tolerancing and want to apply it rigorously to scan data. We will walk callout by callout through flatness, roundness, cylindricity, true position, and profile, cover the alignment strategy that everything else depends on, and close with the two topics that separate credible inspection from wishful thinking: measurement uncertainty, and what to do when your scan disagrees with the CMM. If your team is still building the underlying fundamentals, our GD&T Basics Training is the right starting point, and this article is the applied sequel.
GD&T exists because coordinate dimensions alone cannot describe how a part functions. A hole is never simply “at 40.00 mm.” It has a location tolerance that is meaningless without a datum reference frame, and a size that interacts with that location through material condition modifiers. When you move from a CMM to a full-surface scan, none of that changes. What changes is the volume of data and the number of ways you can fool yourself.
A CMM operator is forced to be deliberate. Every probed point is chosen, so the datum features and the toleranced features are defined by intent. A scanner is indiscriminate. It captures the datum surface, the toleranced surface, the fillet radius blending between them, the burr on the edge, and the fixture behind the part, all at the same density. If you feed that raw mesh into a fitting routine without isolating the correct geometry, the software will happily best-fit a plane through your datum surface plus its edge break plus a smear of noise, and report a flatness value that no CMM would ever produce.
The upside is enormous when you do it correctly. Scan-based GD&T gives you the whole surface rather than a statistical sample of it, which means you catch the localized high spot a 5-point CMM plane would miss entirely. It produces color deviation maps that communicate conformance to non-metrologists in seconds. And it lets you evaluate every instance of a repeated feature instead of sampling three of thirty holes. The discipline required to earn those benefits is what the rest of this article is about. Our metrology and 3D inspection services are built on exactly this discipline.
Before you measure a single tolerance, you have to decide how the scan is oriented in space. Alignment is not a preliminary housekeeping step. It is the single largest source of error in scan-based GD&T, because every location and orientation tolerance is measured relative to the coordinate system you establish. Move the datum reference frame by a few hundredths of a degree and every true position callout on the part shifts with it.
There are two philosophies for locking a scan into a coordinate system, and confusing them is the most common mistake we see in incoming inspection work.
Best-fit alignment minimizes the overall deviation between the scan and the nominal CAD. The software slides and rotates the point cloud until the sum of squared distances is as small as possible. This is the right choice for a form-only question such as “how does this casting deviate from the design surface overall,” and it produces the tidiest-looking color map because error is distributed evenly. It is the wrong choice for GD&T, because it ignores the datum precedence the drawing specifies. A best-fit alignment will borrow from your primary datum to make a distant feature look better, which is precisely the compromise GD&T is designed to forbid.
Datum-based alignment, sometimes called a hierarchical or 3-2-1 alignment, builds the coordinate system the way the drawing dictates. The primary datum constrains three degrees of freedom, the secondary constrains two, and the tertiary constrains the last one. The scan is not allowed to wander to flatter the numbers. This is the only alignment that yields defensible GD&T results, because it reproduces how the part is actually located, clamped, and used in the assembly.
The practical workflow in software such as Geomagic Control X or PolyWorks Inspector is to isolate the regions of the scan that correspond to each datum feature, fit the appropriate geometry to each region (a plane to a planar datum, a cylinder to a datum bore), and then let the software construct the datum reference frame from those fitted features in the specified order. Only after that frame is locked do you evaluate the toleranced features. One caution worth stating plainly: fit datums to the datum features only. Selecting a slightly larger patch that includes a chamfer or a stray edge point tilts the datum plane, and that tilt propagates into every downstream tolerance.
Form tolerances (flatness, straightness, roundness, cylindricity, and profile) are the natural strength of scan data, because they are defined by the surface itself rather than by a datum reference frame. This is where full-surface capture genuinely outperforms a CMM. The catch is that form tolerances are zone-width measurements, which makes them acutely sensitive to outliers. A single spike of noise inflates the zone, so point cloud hygiene matters more here than anywhere else.
Flatness is the distance between two parallel planes that just contain the surface. From scan data, the software isolates the nominally flat region, fits a reference plane (typically a least-squares plane, though a minimum-zone fit is more correct for pass/fail decisions), and reports the peak-to-valley deviation normal to that plane. The result is only as good as the region you selected.
Three things quietly corrupt a scan-based flatness result. The first is edge inclusion: capturing the edge break or the radius where the flat blends into a wall pulls the fit and adds false deviation, so trim the selection back from every edge. The second is noise: raw single-scan data carries measurement scatter that reads as false non-flatness, so a light, form-preserving smoothing pass is appropriate, but heavy smoothing quietly flattens real form error and must be avoided. The third is the fit method itself. A least-squares plane splits the difference and can slightly understate the true zone, while a minimum-zone (Chebyshev) fit finds the two closest parallel planes that actually contain the data and is the method a strict interpretation of the standard expects. Report which one you used.
Roundness (circularity) is evaluated in a single cross section: the radial distance between two concentric circles that contain the measured profile at that slice. Cylindricity extends the same idea into a full 3D zone between two coaxial cylinders. Scan data is well suited to both, because you can evaluate roundness at dozens of cross sections along a bore rather than at the two or three heights a CMM operator would realistically probe.
The subtlety is that a scanner captures the whole cylinder, so how you extract the axis matters. Fit the cylinder to the functional length of the feature, exclude the lead-in chamfer and any relief groove, and evaluate roundness at multiple heights so you catch lobing and taper that a single slice would hide. Barreling and hourglass forms show up immediately in a per-section plot, which is exactly the kind of localized error that sparse CMM sampling misses. As with flatness, decide up front between a least-squares and a minimum-zone fit and stay consistent across the report.
Profile is where scan-based inspection truly leaves a CMM behind. Profile of a surface controls the deviation of an entire 3D surface within a tolerance zone that follows the nominal geometry, and a dense scan measures it directly, point by point, across the whole face. A touch probe can only ever sample it. Profile of a line applies the same control to individual cross sections.
The critical distinction is how the profile is referenced. When the drawing calls out profile with datum references, the tolerance zone is fixed in the datum reference frame and both form and location are being controlled, so you must evaluate it against the datum-based alignment described above. When profile is called out without datums, only form is controlled and a best-fit of the surface region to nominal is appropriate. Applying the wrong alignment to a profile callout is one of the most frequent scan-inspection errors, and it usually produces a result that is off by exactly the amount the part is mislocated. The color deviation map that comes out of a correct profile evaluation is also the single most persuasive artifact you can hand a customer, because conformance and its absence are visible at a glance.

Location and orientation tolerances (position, perpendicularity, parallelism, angularity, concentricity) all depend on the datum reference frame. Unlike form tolerances, you cannot evaluate them from the surface in isolation, which is why the alignment work earlier in this article is a hard prerequisite. If the datums are not locked correctly, every number in this section is wrong by the amount of the alignment error, no matter how clean the scan is.
True position is the tolerance engineers most want from scan data and the one most often computed incorrectly. Position controls the location of a feature’s axis or center relative to the datum reference frame, and it is almost always specified with a diameter symbol, meaning the tolerance zone is a cylinder, not a plus-or-minus box. The measured deviation is the radial distance from the theoretically exact location to the actual axis, doubled, compared against the diametral zone.
From a scan, the procedure is to extract the hole axis by fitting a cylinder to the bore surface, establish the datum reference frame independently, and let the software compute the position deviation in that frame. Two things trip people up. First, extract the axis from the functional depth of the bore, not the chamfer, because a cylinder fit that includes the lead-in tilts the axis and inflates position. Second, respect the material condition modifier. When position is specified at maximum material condition, the feature earns bonus tolerance as its size departs from MMC, and a correct evaluation must combine the measured size of each hole with its location. Scan software handles this automatically only if you feed it the actual measured diameters, so verify that size and location are being evaluated together rather than the location being checked against the stated tolerance alone. Because a scan captures every hole in a pattern, you also get a position result for all of them at once, which reveals pattern-wide shifts that three-hole sampling would never expose.
These orientation tolerances control the tilt of a feature relative to a datum, independent of its location. Perpendicularity holds a surface or axis at 90 degrees to a datum, parallelism holds it at 0 degrees, and angularity holds it at any specified basic angle. From scan data, the mechanics are consistent: fit the controlled feature (a plane for a face, an axis for a bore), reference it to the datum, and report the width of the tolerance zone that contains the feature at the required orientation.
The recurring pitfall is conflating orientation with form. A face can be perfectly flat and still fail perpendicularity if the whole plane is tilted, and it can be perfectly square and still fail flatness if it is wavy. Scan data lets you separate the two cleanly, because you can visualize the fitted feature against the datum and see whether the deviation is a tilt or a texture. Report them as the distinct characteristics they are, and make sure the datum used for the orientation check is the one the drawing specifies, not a convenient nearby surface.
Every measurement has an uncertainty, and a GD&T result reported without one is an opinion dressed as a fact. This matters acutely near a tolerance limit: a position result of 0.098 mm against a 0.100 mm tolerance is a pass only if your measurement uncertainty is small relative to that 0.002 mm margin. If your scan-based measurement uncertainty is 0.03 mm, you genuinely cannot say whether the feature conforms, and reporting a bare pass is misleading.
Scan-based uncertainty has several contributors that stack up differently than they do on a CMM. Scanner accuracy and point noise set a floor, and they vary with distance, angle of incidence, and surface finish. Shiny, dark, and translucent surfaces scatter or absorb the pattern and raise noise, which is why a matting spray or a controlled scanning setup is not cosmetic but a real accuracy control. Alignment uncertainty adds to the floor, because any wobble in the datum fit propagates into every location tolerance. Feature extraction adds more, since the fit is only as stable as the number and spread of points on the feature and how well you isolated it. And environmental factors, particularly temperature, shift the whole part relative to a 20 degree C nominal.
The practical guidance is a rule most quality standards already imply: your measurement uncertainty should be a small fraction of the tolerance you are verifying, commonly a tenth or better. When it is not, the honest options are to reduce uncertainty (denser scan, better matting, a more stable alignment, temperature control) or to escalate the tightest callouts to a CMM. Which brings us to the most uncomfortable question in scan-based inspection.
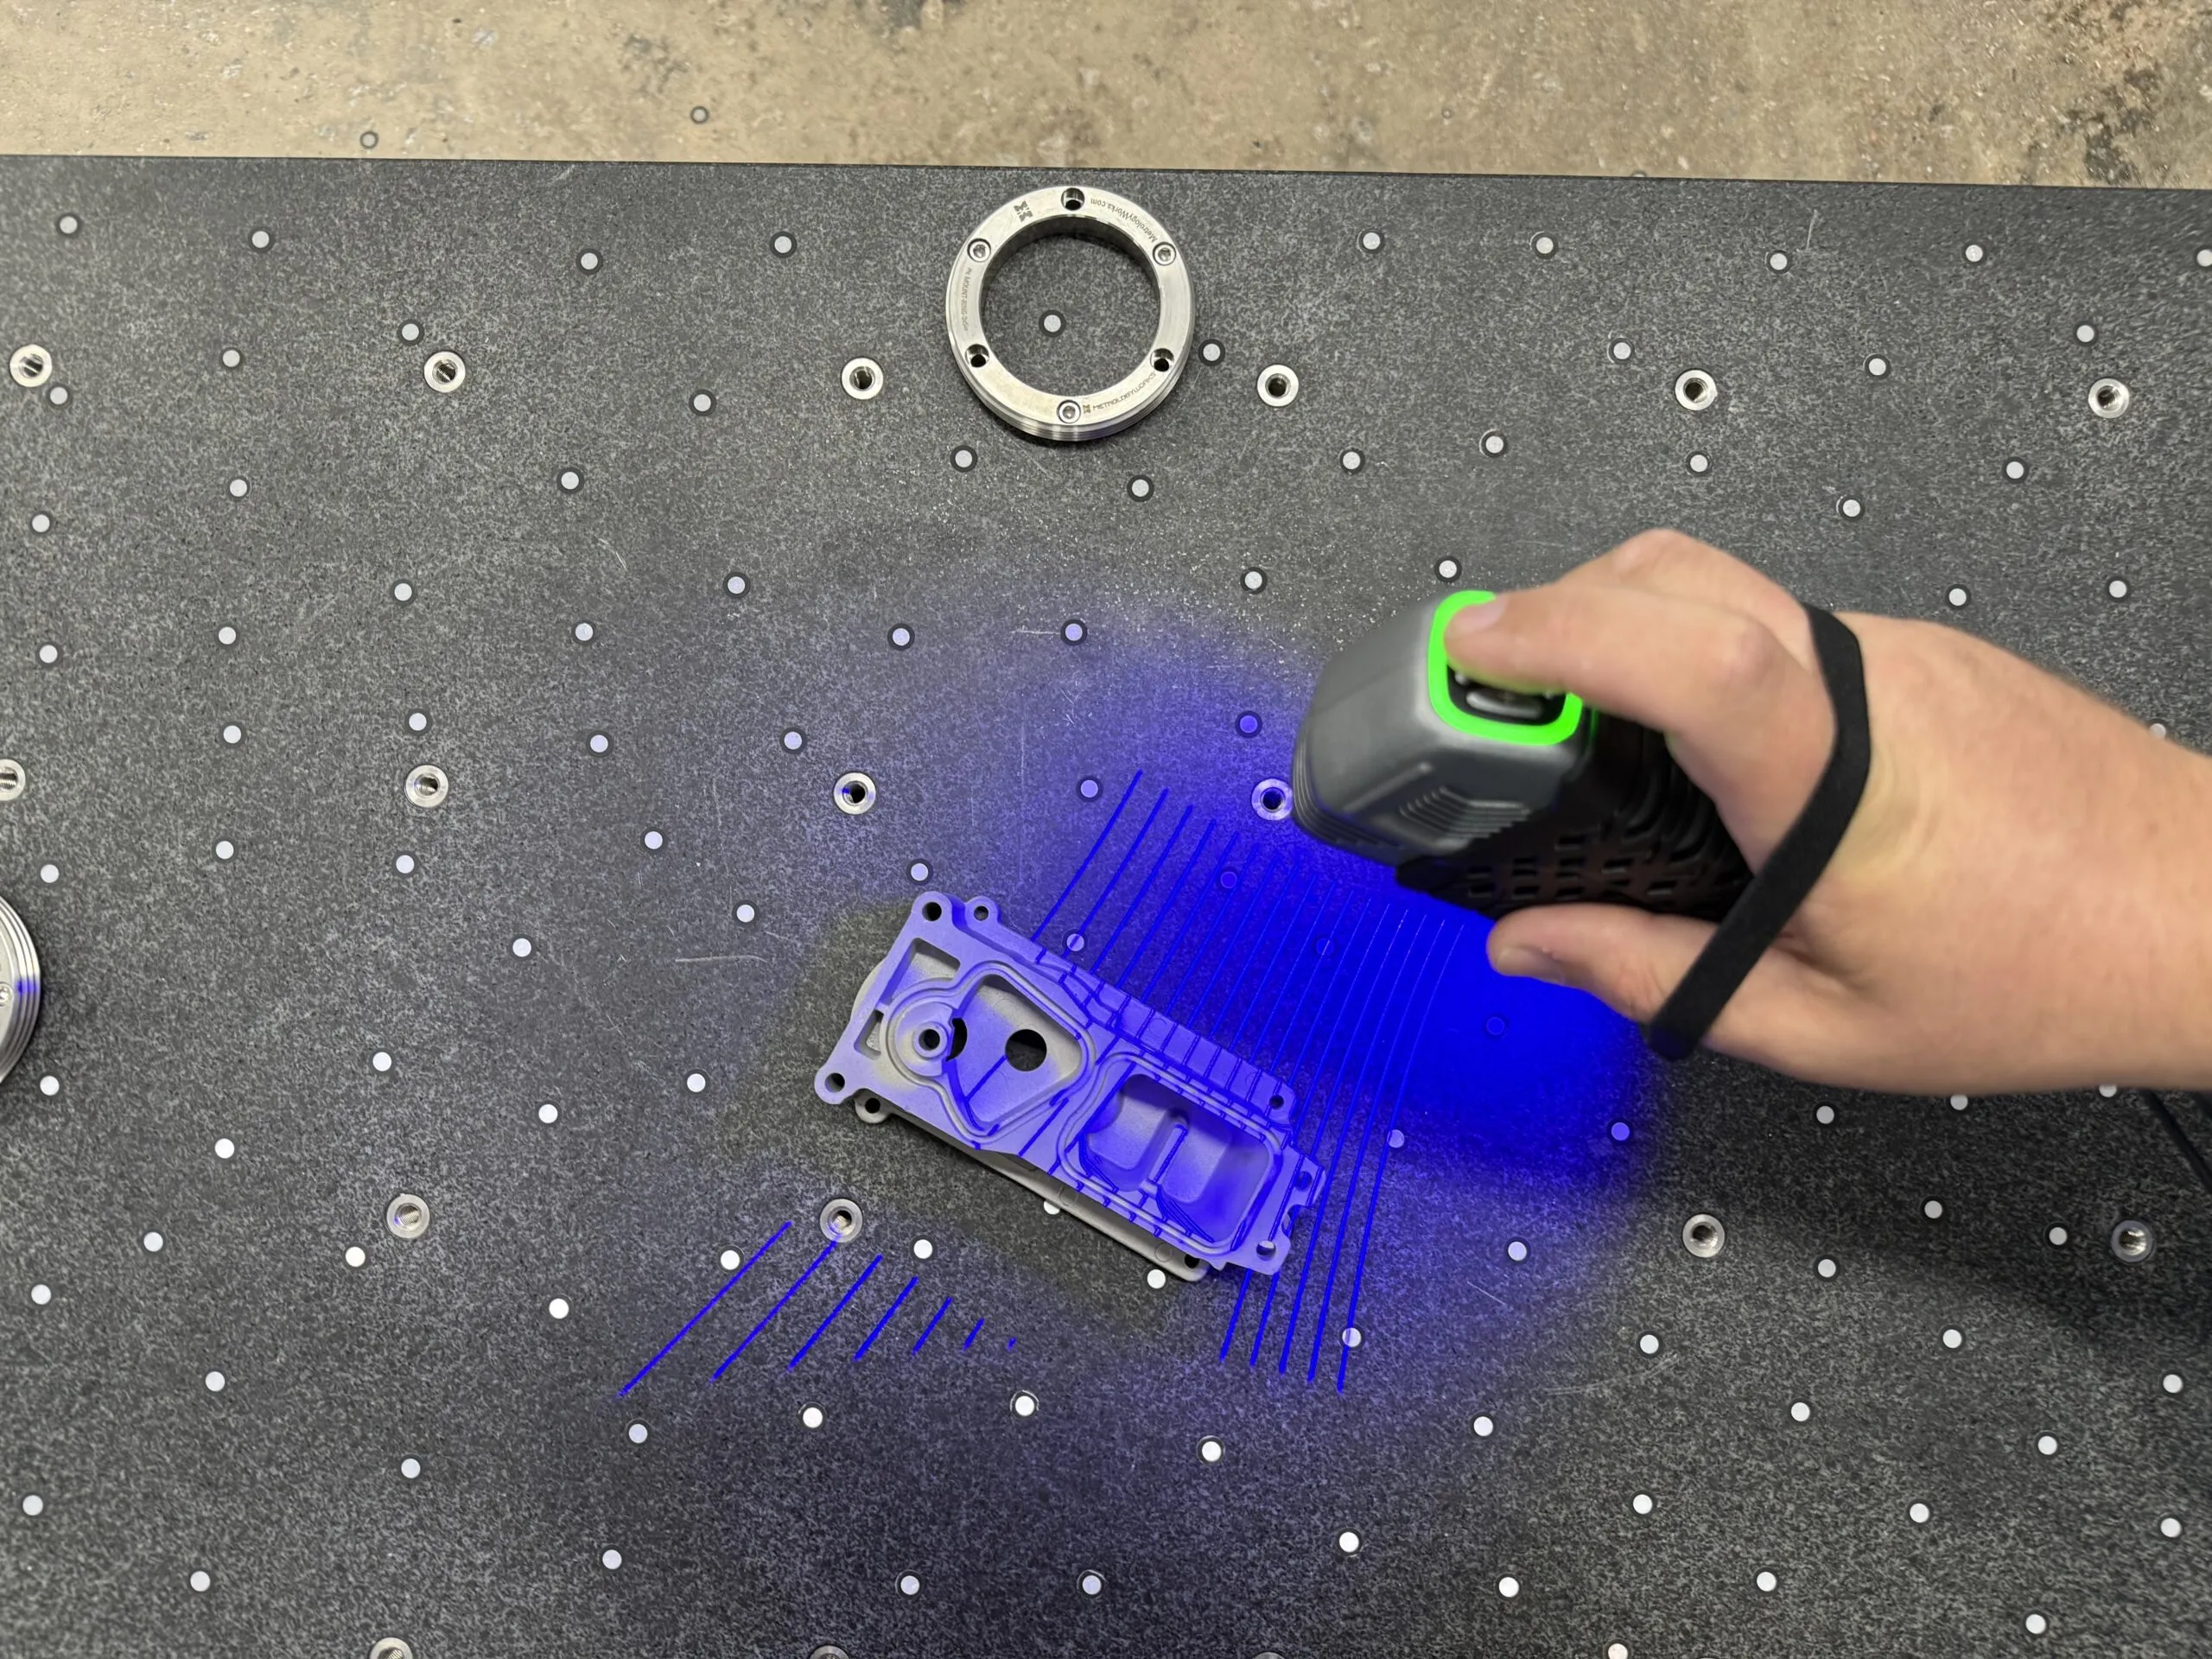
Sooner or later a customer will place your scan report next to a CMM report and the position numbers will differ. This is not a crisis and it does not automatically mean the scan is wrong. The two methods measure differently, and understanding why they disagree is a mark of competence, not a failure.
The most common cause is not the hardware at all. It is alignment. A CMM operator probing a 3-2-1 datum scheme and a scan technician running a best-fit are answering two different questions, and their position results will diverge by the amount the part is mislocated. Before blaming the scanner, confirm that both reports used the same datum reference frame in the same precedence. Nine times out of ten, reconciling the alignment reconciles the numbers.
The remaining differences are usually explainable and often favor the scan. A CMM samples a feature with a few points and fits geometry to them, so it can miss a localized high spot that a full-surface scan captures, making the scan’s form and position values legitimately larger and more conservative. Probe compensation, the finite stylus tip radius, and the CMM’s own sampling strategy introduce their own small biases. And surface effects (a probe pushing through a soft burr that a scanner sees as solid geometry) can move a datum. A disciplined reconciliation walks through these in order: match the alignment first, then compare feature extraction, then compare sampling density, then account for each instrument’s uncertainty. When you can explain the delta in those terms, the disagreement becomes a data point both parties trust rather than an argument. For high-stakes parts, the right answer is often to use both: scan for full-surface form and profile where it dominates, and confirm the tightest position callouts on the CMM.
A measurement no one can interpret has no value. The deliverable of scan-based GD&T is not the scan, it is a report an engineer, an auditor, and a customer can all read and trust. A defensible report ties every result back to the drawing and makes its assumptions explicit.
A complete scan-based GD&T report should include the following:
Tools such as Geomagic Control X and PolyWorks Inspector generate templated reports that capture most of this automatically, but the templates are only as honest as the person configuring them. The value we add is the judgment behind the report: choosing the right alignment, isolating features correctly, and stating uncertainty plainly, so the numbers hold up under scrutiny.
Scan-based GD&T is not a shortcut around metrology discipline, it is metrology discipline applied to a far richer dataset. The scanner gives you complete coverage of the surface, but the reliability of every flatness, roundness, and true position result still comes from the same three decisions: align the part the way the drawing dictates, extract each feature from the correct geometry, and state your uncertainty honestly. Do those three things and a scan will match a CMM where they overlap and outperform it on form and profile where full-surface data wins.
If you have parts that need scan-based GD&T inspection, or a team that wants to build this capability in-house, our engineers do this work every day. Explore our metrology and 3D inspection services, or contact us to talk through a specific part and the tolerances that matter on it.
You have a part on the bench and no drawing for it. Or you have the drawing, and now you
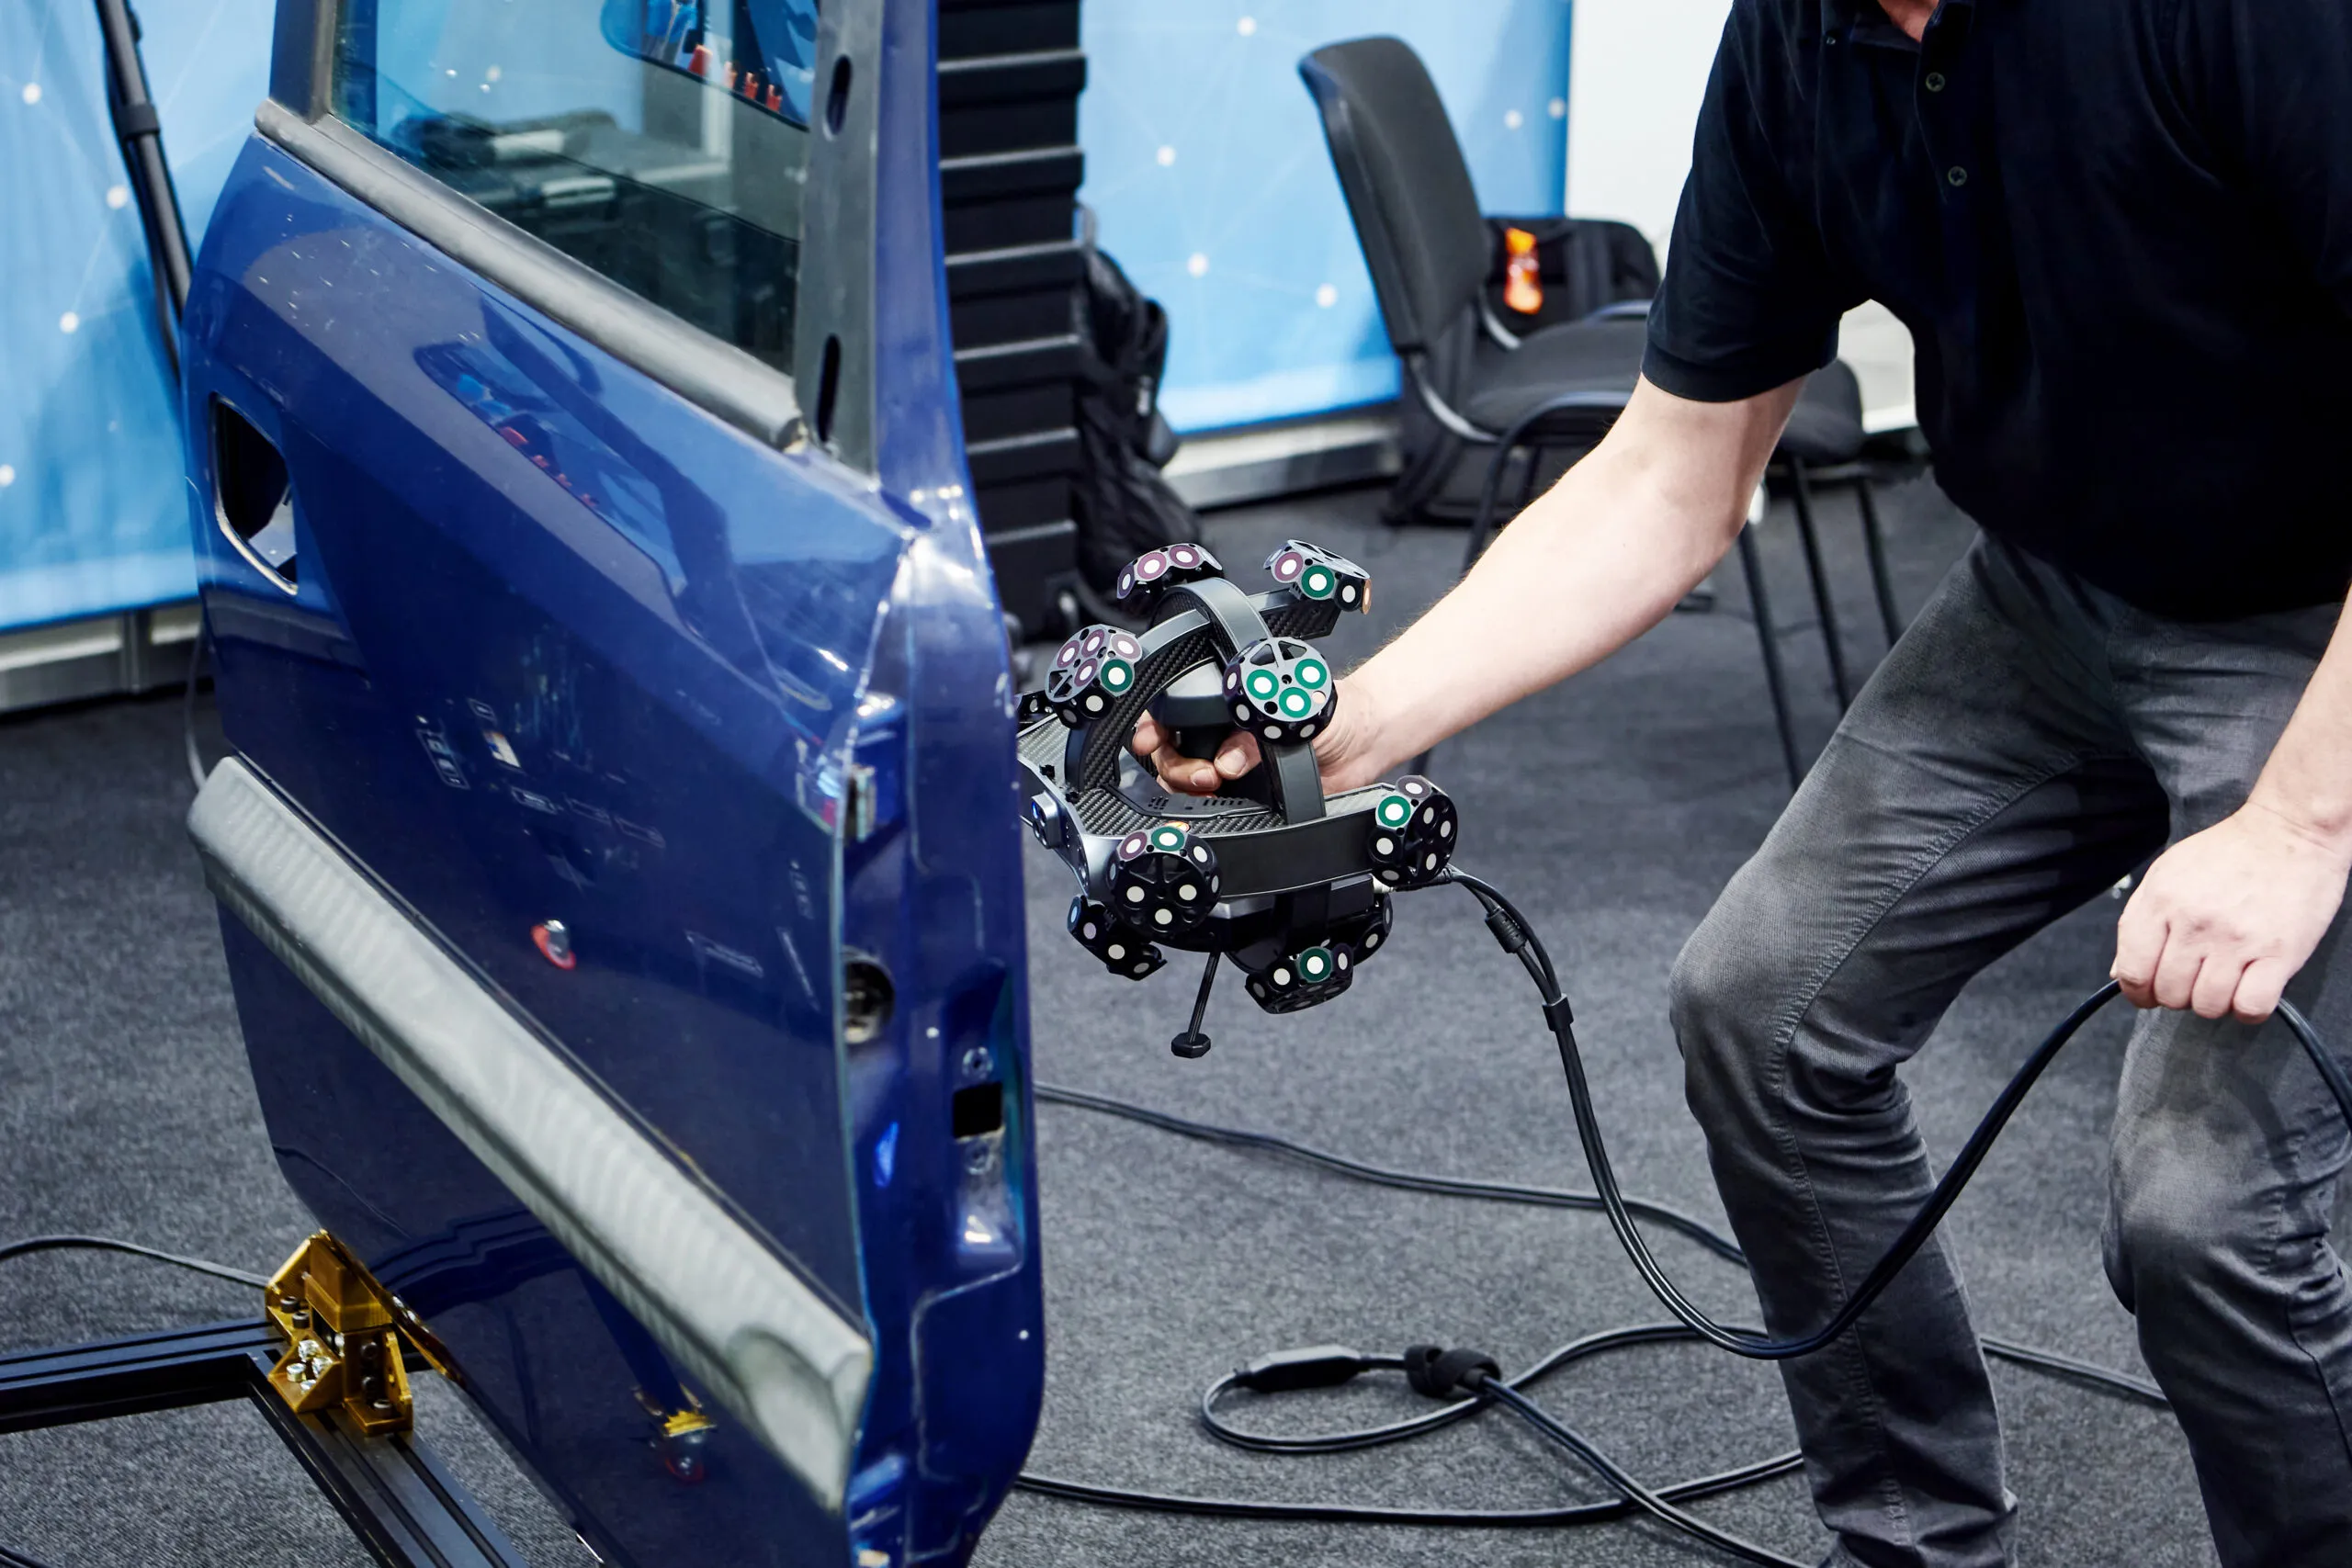
A fender comes off the press and something is off. The hole pattern checks out on the CMM and every

For most of the twentieth century, a crime scene was preserved with a tape measure, a roll of film, and
If you have ever searched for a way to turn a physical object into a digital model, you have probably